How to build private equity portfolio reporting in Sigma
Collect monthly KPIs from portfolio companies, map each chart of accounts to one standard, roll them up, and send board and LP packs from Sigma on a schedule.

Written by Linus Tse, founder of Greyfield Data
· 7 min read
On this page 9 sections
Portfolio reporting at a private equity firm usually means chasing spreadsheets. Each portfolio company sends its monthly numbers in its own template, with its own account names, a few days late. Someone on the deal team or in finance retypes them into a master workbook, then builds the board and LP decks from that.
We build portfolio reporting in Sigma on Snowflake so companies submit into one structure, the mapping happens once, and the packs refresh themselves. That is part of our Sigma Computing consulting work for private equity firms.
Key takeaways
- Collect monthly KPIs either by having companies type into a Sigma input table or by uploading a standard CSV. Both write to your warehouse.
- Map each company's chart of accounts to one standard set of lines with a mapping table. Do it once per company and reuse it every month.
- Roll up the standard lines across companies by fund, sector and vintage.
- Track value creation with a simple bridge: EBITDA growth, multiple change, and net debt change.
- Send board and LP packs on a schedule instead of rebuilding slides each month.
What should private equity portfolio reporting include?
Portfolio reporting should show how each company is performing against plan, how the portfolio looks in total, and what is driving value. Most firms track a similar core set.
| Area | Typical monthly KPIs |
|---|---|
| Income statement | Revenue, gross profit, EBITDA, adjusted EBITDA |
| Plan | Budget and prior year for each line, with the variance |
| Cash and debt | Cash balance, total debt, net debt, covenant measures |
| Operations | Headcount, customers, bookings, or the sector's own drivers |
| Value creation | Progress on the initiatives in the investment plan |
Keep the shared list short. Every extra line is a line each company has to fill in every month. Add company-specific KPIs as a separate, optional set.
How do you collect monthly KPIs from portfolio companies?
Give companies one of two routes: type into a form-like table, or upload a file in a standard layout. Both land in Snowflake in the same shape.
| Route | How it works | Best for |
|---|---|---|
| Input table | The company's finance lead enters numbers in a Sigma input table, one row per KPI per month | Smaller companies, a short KPI list |
| CSV upload | The company exports from its own system and uploads a file through Sigma's CSV upload | Companies with many accounts, trial balance submissions |
| File drop | The company sends a file to a shared folder that loads into Snowflake | Firms that already run a data pipeline |
Sigma input tables write their data to your warehouse, and they can show who created or last updated each row and when (input tables). That gives you a record of who submitted what.
Two governance settings keep submissions clean:
- Data validation limits a column to a set list, such as the standard KPI names, so nobody types "Rev." instead of "Revenue".
- Data entry permissions control who can edit each input table.
For CSV uploads, Sigma's default size limit is 200MB, and an admin can raise it. The connection needs write access.
How do you map different charts of accounts?
Build a mapping table: one row per company account, with the standard line it rolls into. Each month's numbers join to the mapping, so you map once per company, not once per month.
The diagram shows the flow from company submissions to the packs.
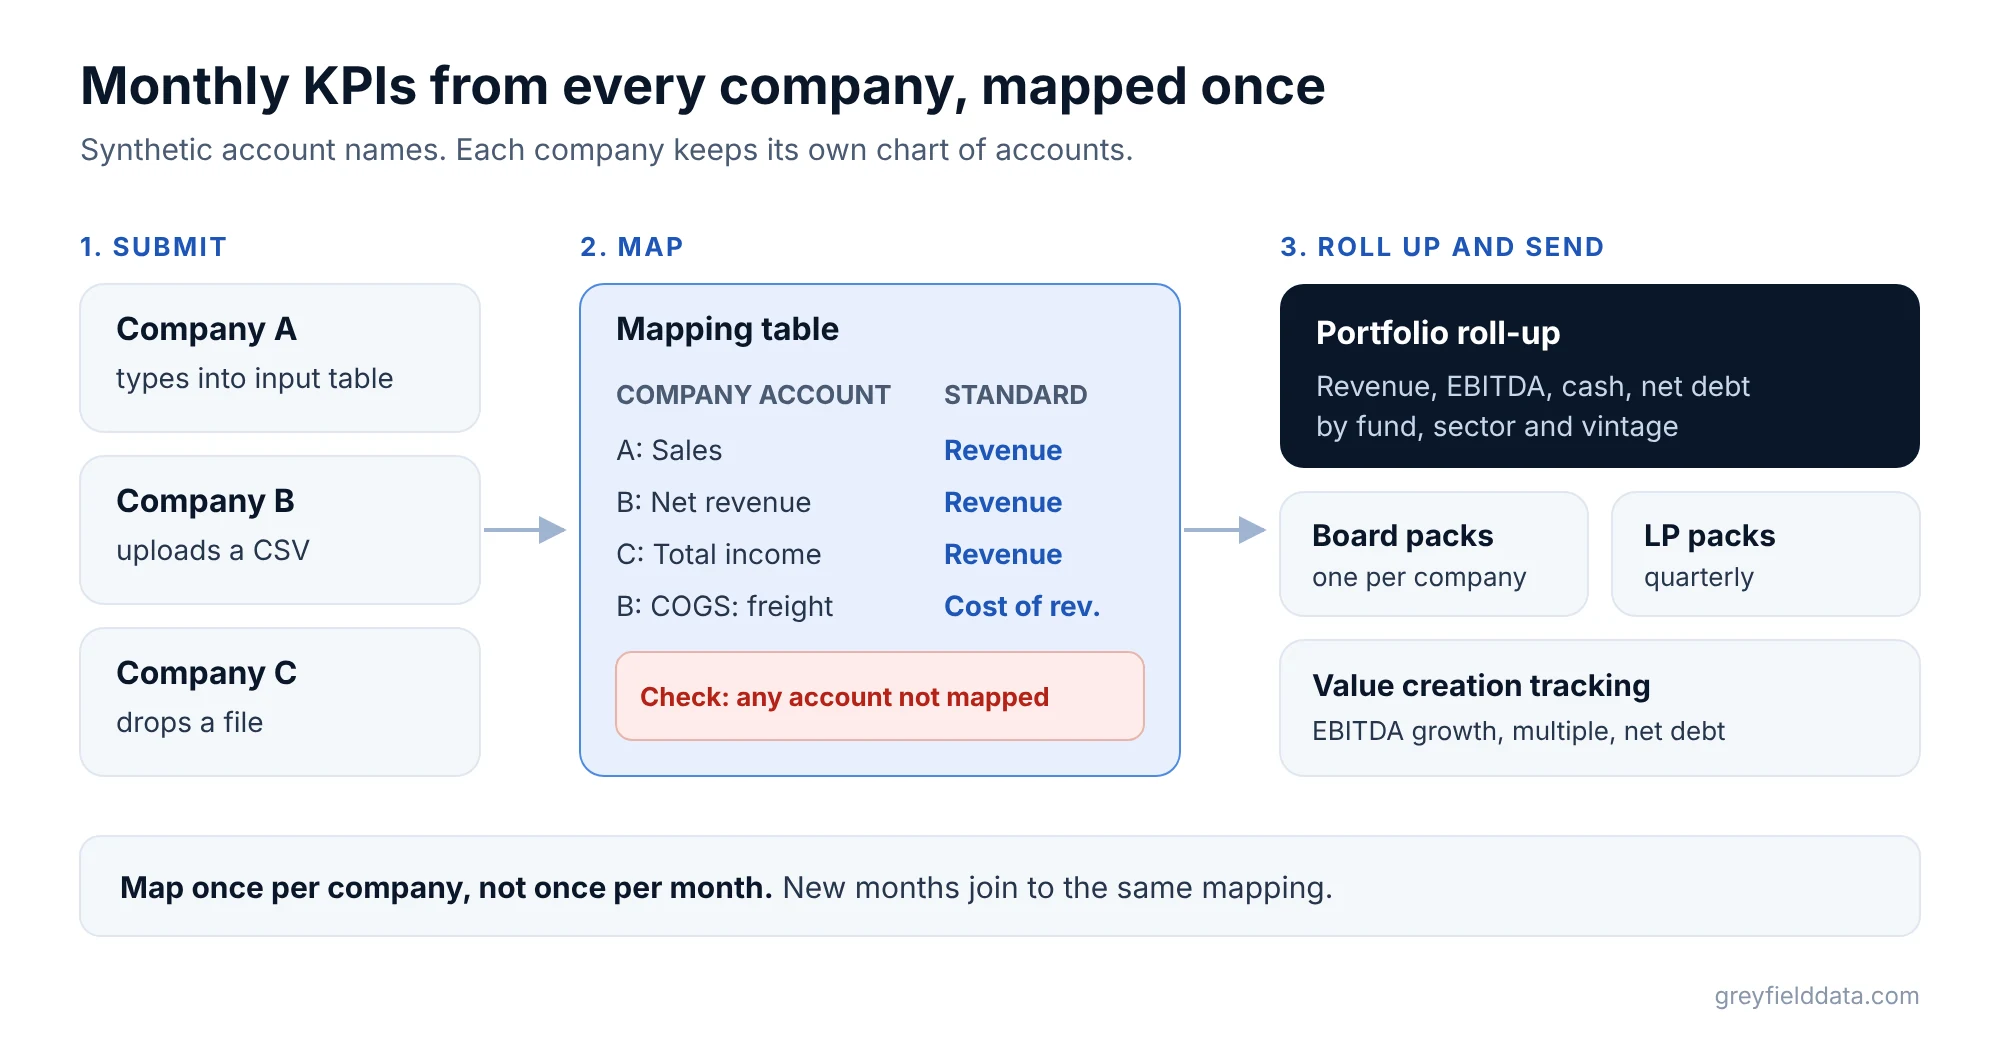
Here is a synthetic mapping example.
| Company | Company account | Standard line |
|---|---|---|
| Company A | Sales | Revenue |
| Company A | Cost of sales | Cost of revenue |
| Company B | Net revenue | Revenue |
| Company B | COGS: materials | Cost of revenue |
| Company B | COGS: freight | Cost of revenue |
| Company C | Total income | Revenue |
The mapping table can itself be an input table, so your finance team maintains it in Sigma. A lookup joins it to each submission. Add a check that lists any account with no mapping, so a new account never disappears from the totals.
Decide the hard cases up front: how to treat one-off items in adjusted EBITDA, which currency to report in, and whether each company reports on its own fiscal calendar. Write the rules down where the deal team can see them.
How do you roll up KPIs across the portfolio?
Once every company reports in standard lines, a roll-up is a sum by fund, sector or vintage. The work is in the rules, not the math.
- Currency: convert each company at a stated rate, such as the month-end rate, and show which one.
- Calendar: align fiscal months to calendar months, or report each company on its own calendar and label it.
- Late companies: show who has not submitted rather than quietly using last month's numbers.
- Ownership: show totals at 100% of each company. If you also show a share based on the fund's ownership, label it clearly.
A submission tracker on the first page of the workbook helps: one row per company, with the month, the status, and who submitted.
How do you track value creation?
A value creation bridge splits the change in a company's equity value into a few plain parts: EBITDA growth, change in the valuation multiple, and change in net debt.
Here is a synthetic example.
| Item | Entry | Current |
|---|---|---|
| EBITDA | $10.0M | $13.0M |
| EV/EBITDA multiple | 8.0x | 9.0x |
| Enterprise value | $80.0M | $117.0M |
| Net debt | $30.0M | $25.0M |
| Equity value | $50.0M | $92.0M |
The $42.0M change in equity value splits into:
| Driver | Calculation | Value |
|---|---|---|
| EBITDA growth | $3.0M more EBITDA × 8.0x entry multiple | $24.0M |
| Multiple change | 1.0x higher multiple × $13.0M current EBITDA | $13.0M |
| Net debt change | $30.0M minus $25.0M | $5.0M |
| Total | $42.0M |
Bridges can be ordered differently, and the order changes how much lands in each bar. Pick one method and keep it the same across the portfolio. Valuations themselves come from your valuation process, not the reporting tool.
Alongside the bridge, track the initiatives from each investment plan, such as pricing changes or new sites, as rows in an input table with an owner, a target and a status.
How do you send board and LP packs from Sigma?
Build each pack once, then schedule it. Sigma's scheduled email exports can run monthly on a set day, and the whole workbook or one page can go as a PDF (export formats).
- Portfolio company board packs: one page per company, filtered by a company control. Export Bursting can send each board its own version.
- Fund-level and LP packs: the roll-up, plus the value creation bridges, on the quarterly schedule.
- Internal monitoring: a live workbook for the deal team, with row-level security if teams should see only their companies.
To send a different PDF to each company board or LP, see our Export Bursting walkthrough. For the board pack layout itself, see how to build a board reporting pack in Sigma.
Keep a review step before anything leaves the firm. Your investor relations and compliance teams decide what LPs receive.
Frequently asked questions
What is private equity portfolio reporting?
It is the monthly and quarterly reporting a PE firm does on its portfolio companies: KPIs against plan, cash and debt, value creation, and the board and LP packs built from them.
How do portfolio companies submit KPIs into Sigma?
They can type into a Sigma input table, upload a CSV in a standard layout, or drop a file that loads into Snowflake. All three end up as rows in the same warehouse tables.
How do you compare companies with different charts of accounts?
Map each company account to a standard line in a mapping table, once per company. Monthly numbers join to the mapping, so every company reports in the same lines.
Can Sigma replace portfolio monitoring software?
For many firms, Sigma on Snowflake covers KPI collection, roll-ups and packs. Dedicated portfolio monitoring tools may include features such as company-facing portals, so compare what you need before you choose.
What to do next
Write your shared KPI list on one page and send it to two portfolio companies for comment. If both can fill it in from their own systems in under an hour, it is the right length. To see what the current monthly rebuild costs you, try the reporting time calculator. If you want us to build the collection, mapping and packs with you, see Sigma Computing consulting or book a call.
Part of the Sigma guides, a reading path through related articles.
Linus Tse
Founder of Greyfield Data. Built 400+ dashboards. Certified in Sigma, Snowflake, Tableau, and Power BI.
About Linus