Running Totals in Sigma: Cumulative Sums and Moving Averages
How to build a running total in Sigma with CumulativeSum, restart it for each group or year, and add moving averages that don't mislead in the first rows.

Written by Linus Tse, founder of Greyfield Data
· 7 min read
On this page 8 sections
A running total answers "how far are we into the year?" without anyone adding up months by hand. In Sigma it's one function, CumulativeSum. Getting it to restart for each region or each year depends on where you put it, not on the formula.
Moving averages work the same way and have one extra trap in the first rows. If you're rebuilding spreadsheet trackers in Sigma and want help, that's part of our Sigma Computing consulting work.
Key takeaways
- CumulativeSum adds up a column from the first row to the current row:
CumulativeSum([Monthly Sales]). - The result follows the table's sort order. Change the sort and every running total changes.
- In a grouped table, the running total restarts for each group above it. Put
CumulativeSumin the Month grouping under a Region grouping, and each region gets its own running total. - MovingAvg averages a window of rows:
MovingAvg([Monthly Sales], 2)is the current month and the two before it. The first rows average fewer months. - Window functions count rows, not dates. If a month has no row, the window spans the wrong months.
How do you create a running total in Sigma?
Group your table by period, add the measure, then add a CumulativeSum column on it. Here is the setup on a synthetic table of monthly sales.
Select the table and, under Groupings, click Add grouping and pick
Month of Order Date. UseDateTrunc("month", [Order Date])if you need to make it.Under Calculations for that grouping, add
Monthly SalesasSum([Sales]).Add another calculation in the same grouping:
CumulativeSum([Monthly Sales])Rename it
Running Totaland sort the table by month, ascending.
Sigma's docs give a simple check: if the column holds 2, 4, 6, 8 and 10, CumulativeSum returns 2, 6, 12, 20 and 30.
Why sort order matters
Sigma's CumulativeSum page says cumulative functions depend on the order of the column. Sort descending and the running total starts from the latest month instead of the first. If a viewer can re-sort the table, put the running total on a chart or lock the sort before you share it.
How do you restart a running total for each group?
Add a higher grouping. Sigma applies the cumulative sum separately to each grouping above the level where the formula sits.
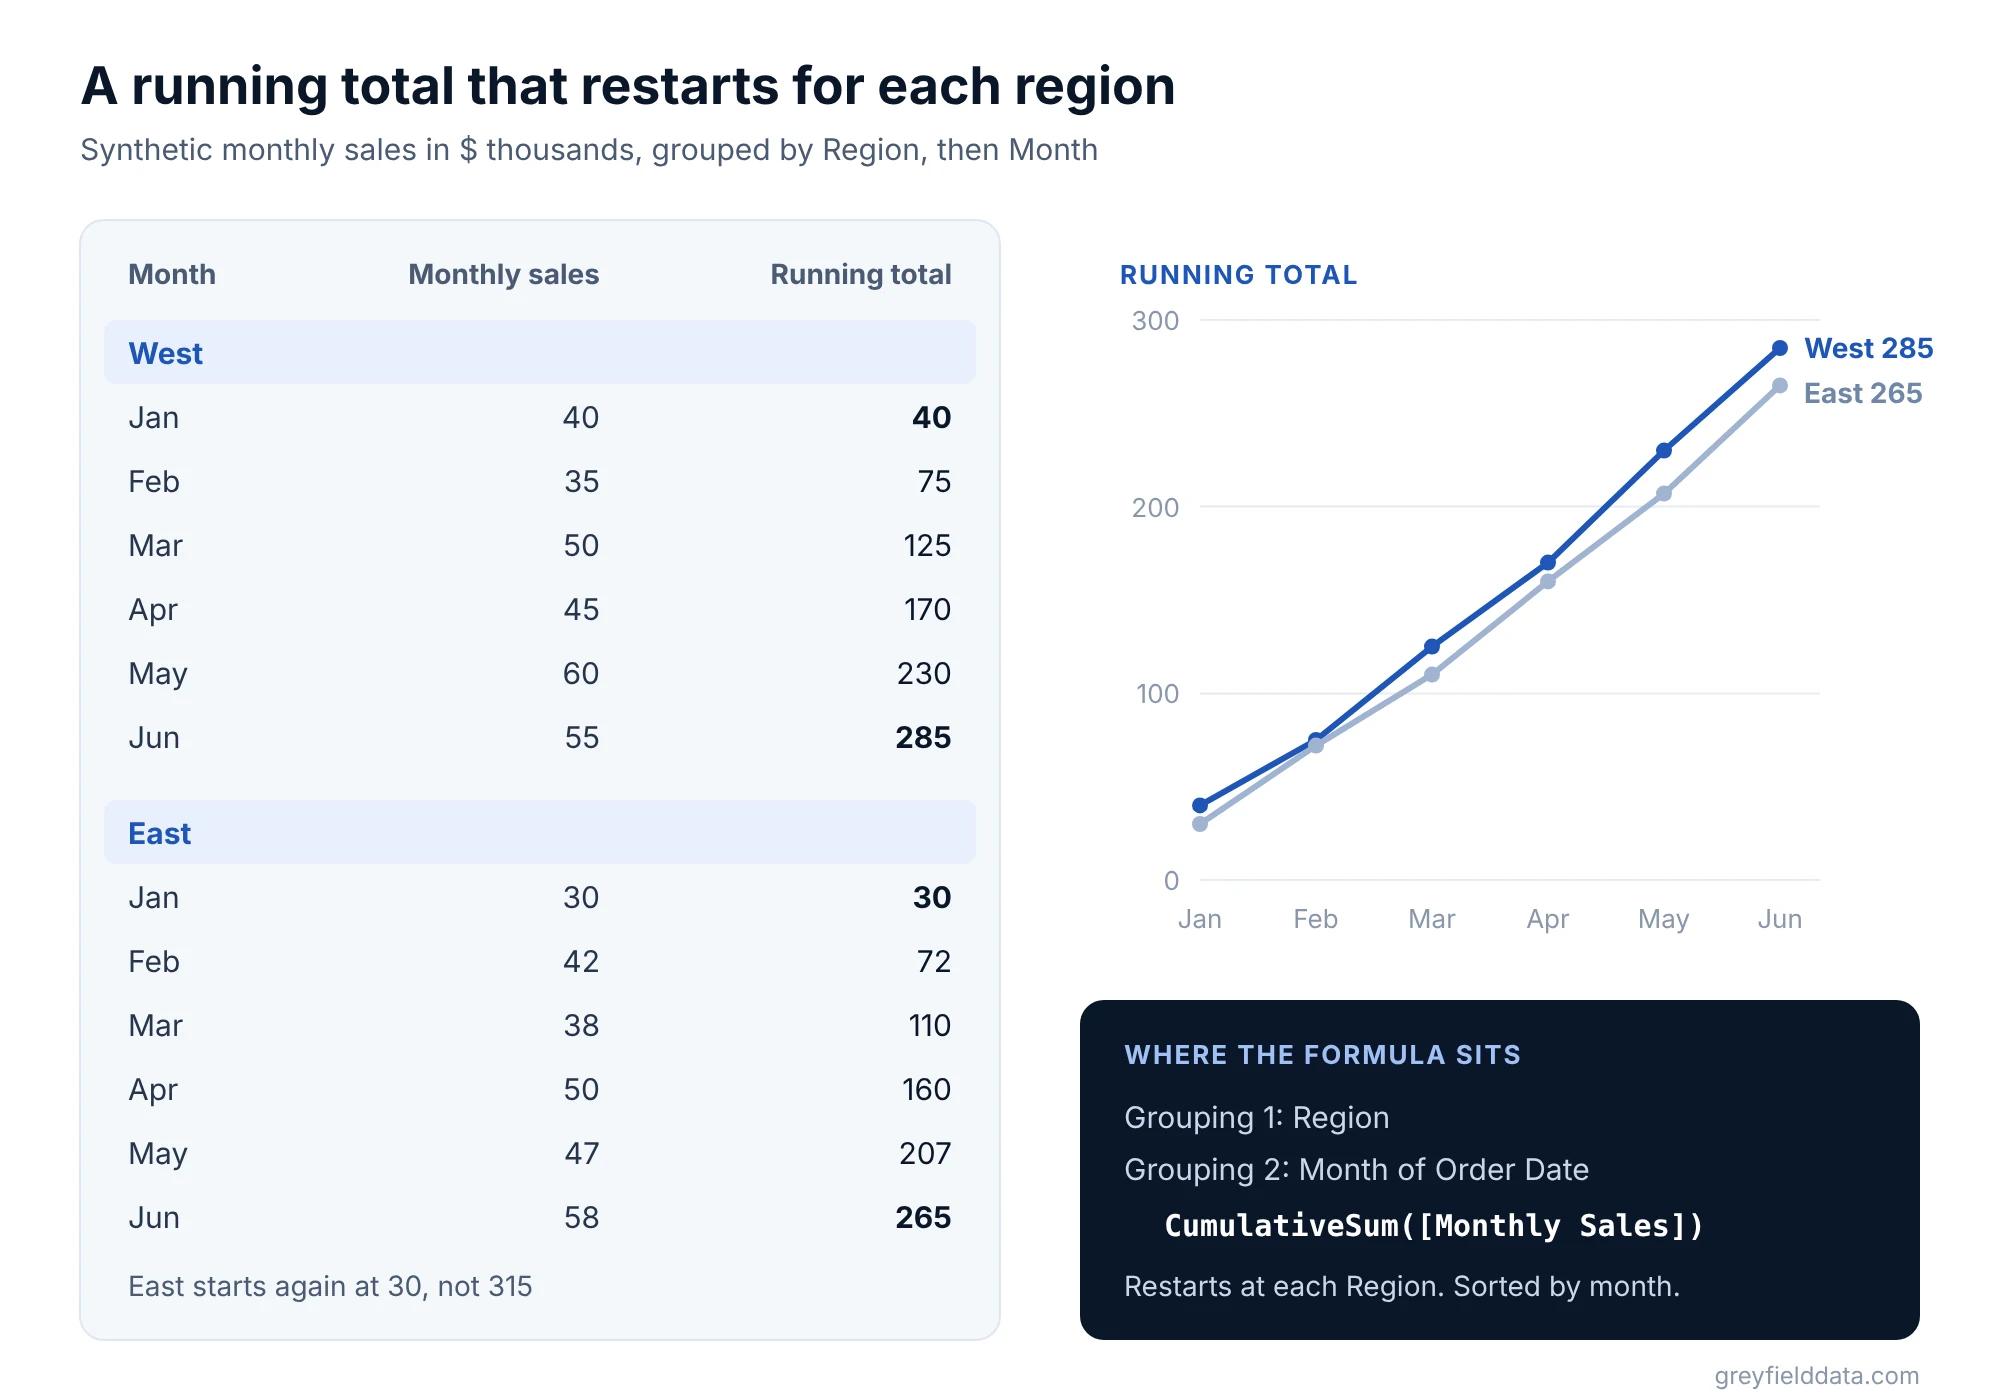
Here is synthetic monthly sales for two regions, in thousands of dollars:
| Region | Month | Monthly sales | Running total | 3-month moving avg |
|---|---|---|---|---|
| West | Jan | 40 | 40 | 40.0 |
| West | Feb | 35 | 75 | 37.5 |
| West | Mar | 50 | 125 | 41.7 |
| West | Apr | 45 | 170 | 43.3 |
| West | May | 60 | 230 | 51.7 |
| West | Jun | 55 | 285 | 53.3 |
| East | Jan | 30 | 30 | 30.0 |
| East | Feb | 42 | 72 | 36.0 |
| East | Mar | 38 | 110 | 36.7 |
| East | Apr | 50 | 160 | 43.3 |
| East | May | 47 | 207 | 45.0 |
| East | Jun | 58 | 265 | 51.7 |
To get this layout:
- Add a grouping on
Region. - Add a second grouping on
Month of Order Datebelow it. - Put
Monthly Sales,Running Totaland the moving average in the Month grouping's calculations.
The West running total ends at 285 and the East one starts again at 30. If you put CumulativeSum in a table with no Region grouping, East's January would continue from West's June instead.
Restart every year for year to date
The same rule gives you a year-to-date total. Group by Year of Order Date, then by month, and put CumulativeSum in the month grouping. Sigma's docs use this exact example: profit by month for two years, with the running total restarting at the start of each year.
How do you calculate a moving average in Sigma?
Use MovingAvg(column, above, below). above is how many rows before the current row to include, and below is how many after. Sigma's MovingAvg page notes it must be used with aggregated data in a grouped table.
For a three-month moving average in the table above:
MovingAvg([Monthly Sales], 2)
That's the current month and the two above it. below defaults to 0. For West in March, it's (40 + 35 + 50) / 3 = 41.7.
| Formula | Window | Use it for |
|---|---|---|
MovingAvg([Monthly Sales], 2) |
Current row and 2 above | Trailing 3-month average in an ascending table |
MovingAvg([Monthly Sales], 2, 2) |
2 above, current, 2 below | Centered smoothing for a chart |
MovingSum([Monthly Sales], 11) |
Current row and 11 above | Trailing 12-month total |
CumulativeAvg([Monthly Sales]) |
Every row so far | Average month so far this year |
MovingAvg([Weekly Sales], [above-control], [below-control]) |
Set by number controls | Let viewers pick the window |
The last row is based on Sigma's own example, which uses number input controls for the window size. MovingSum and CumulativeAvg follow the same rules on sort order.
Watch the first rows
A moving average needs enough rows above it. West's January "3-month average" is just January, and February's is two months. On a chart, those early points look like real three-month averages.
To leave them blank, count the rows in the window with MovingCount:
If(MovingCount([Monthly Sales], 2) = 3, MovingAvg([Monthly Sales], 2), Null)
West's January and February now show nothing, and March shows 41.7.
Direction depends on the sort
above and below are positions in the table, not earlier and later dates. In a table sorted by month descending, the rows above are later months. Sigma's own MovingAvg examples use a descending table, which is why they read differently from an ascending one.
Why does my running total skip or double count?
Usually because window functions count rows, not dates. Sigma calls MovingAvg a position-based calculation and says to make sure the table has a sorted column.
- Missing periods. If East had no sales in April, there's no April row. The moving average for May would then cover February, March and May.
- Unsorted tables. Without a sort, Sigma's MovingSum docs warn you can get unexpected results.
- Wrong grouping level. If the cumulative column sits in the Region grouping instead of the Month grouping, you get a running total of regions, not months.
- Duplicate months. If the month grouping also holds another column, each month splits into several rows.
For missing periods, the reliable fix is a date table with every month, joined to your sales so empty months show as zero. If your warehouse doesn't have one yet, it's a small addition, and the kind of thing we set up in Snowflake consulting work.
Running total or period comparison?
A running total shows progress through a period. A comparison shows change against another period. They answer different questions and often sit side by side.
| Question | Use |
|---|---|
| How much have we sold so far this year? | CumulativeSum in a Month grouping under a Year grouping |
| Is the trend going up once you smooth out noise? | MovingAvg |
| How does this month compare to last year? | DateLookback, see year-over-year comparison in Sigma |
| What share of the year did each month bring in? | PercentOfTotal, see the Sigma functions list |
To chart a running total as a line next to monthly bars, the combo chart post covers the axis setup. If you're moving from Excel, the Excel to Sigma functions cheat sheet explains why formulas work on columns instead of cell ranges like =SUM($B$2:B2).
Frequently asked questions
How do I do a cumulative sum in Sigma?
Add a column with CumulativeSum([Column]) to a table sorted by date. In a grouped table, add it as a calculation in the lowest grouping, such as Month.
How do I make a Sigma running total reset for each group?
Add a grouping above the one that holds the cumulative sum. Sigma applies CumulativeSum to each higher grouping separately, so a Region grouping above Month gives each region its own running total.
Why does my Sigma running total change when I sort the table?
Cumulative functions follow the table's sort order. Sort by date ascending to get a running total from the first period forward.
How do I calculate a 3-month moving average in Sigma?
Use MovingAvg([Monthly Sales], 2) in a table grouped by month and sorted ascending. It averages the current month and the two months above it.
Does Sigma have a running total quick calculation?
The documented route is the CumulativeSum function and the other cumulative functions, such as CumulativeAvg and CumulativeCount, added as a column or grouping calculation.
What to do next
Take one monthly table, add a Year grouping above the month, and put CumulativeSum in the month grouping to get year to date. Then check a month with no sales before you share it. If you'd like help rebuilding trackers like this from Excel, book a call with me.
Part of the Sigma guides, a reading path through related articles.
Linus Tse
Founder of Greyfield Data. Built 400+ dashboards. Certified in Sigma, Snowflake, Tableau, and Power BI.
About Linus