Sigma Pivot Tables: Rows, Columns, Values, and Subtotals
How to build a Sigma pivot table with pivot rows, columns and values, control subtotals and grand totals, and know when a grouped table works better.

Written by Linus Tse, founder of Greyfield Data
· 8 min read
On this page 9 sections
If you've built pivot tables in Excel, Sigma's will feel familiar within a minute: rows down the side, columns across the top, values in the middle. The differences are in totals, in formulas that refer to totals, and in knowing when a grouped table does the job better.
Pivots are usually the first thing finance users rebuild when they move a report to Sigma. If you want help moving a set of Excel or Tableau reports, that's part of our Sigma Computing consulting work.
Key takeaways
- A Sigma pivot table has three properties: Pivot rows, Pivot columns and Values. It shows nothing until you add a row or a column.
- Numeric values are summed by default, and text and date values are counted. Change it from the column's Set aggregate menu.
- Totals are on by default. Hide grand totals or subtotals under Format > Totals, and change a subtotal's aggregate or write a custom formula for it.
PercentOfTotalandSubtotaltake pivot modes such as"row","column"and"row_parent", for percent of row, column, or parent subtotal.- Use a grouped table instead when you only need one direction of grouping, want to expand into row detail, or need running totals within groups.
How do you create a pivot table in Sigma?
Add a pivot table from Add element > Data > Pivot table, or as a child of an existing table, then fill in the three properties in the editor panel.
- Select the pivot table and open the Properties tab.
- Under Pivot rows, add
Region. - Under Pivot columns, add
Quarter of Order Date. - Under Values, add
Revenue. Sigma sums it.
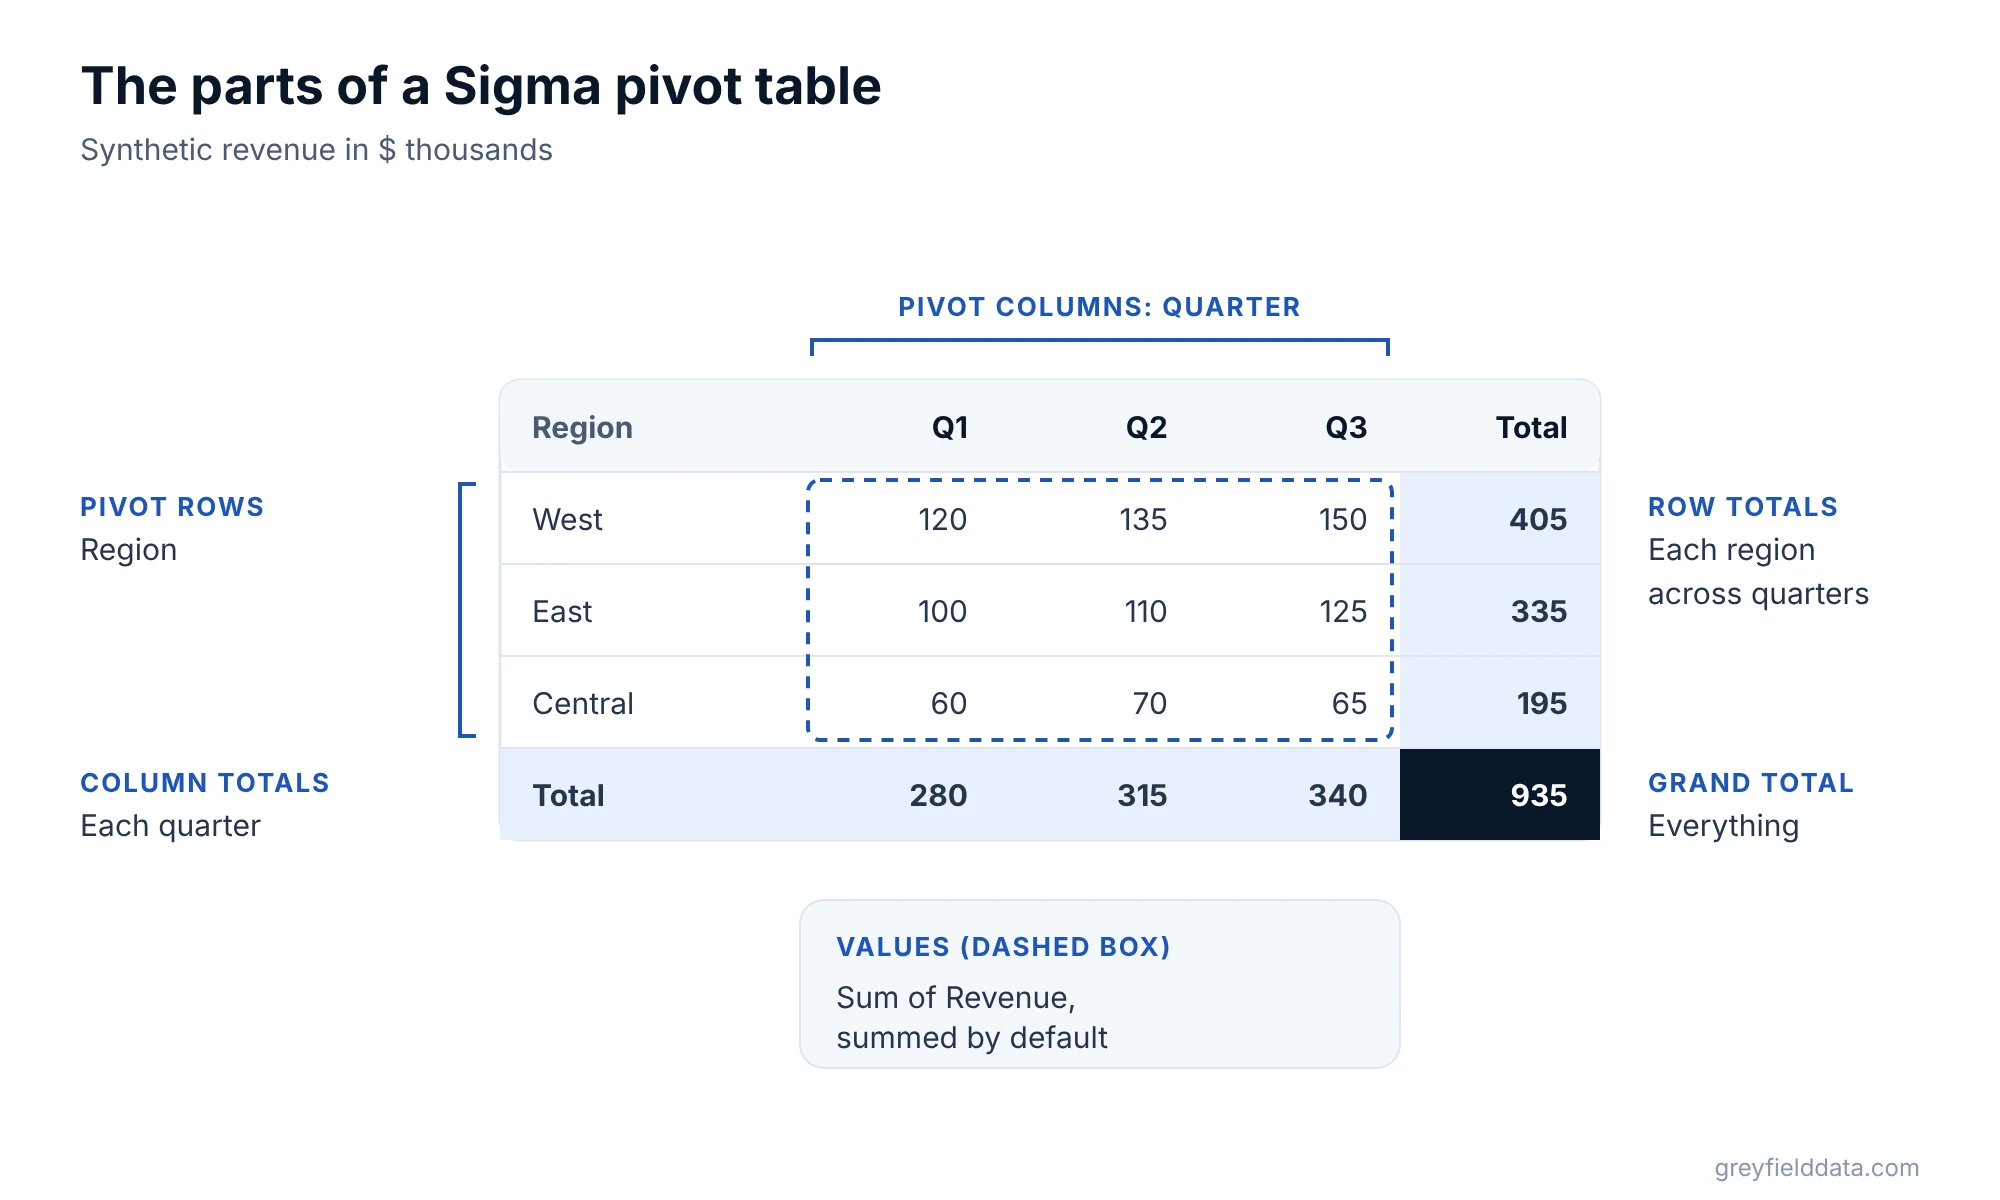
Here is the result on synthetic data, in thousands of dollars:
| Region | Q1 | Q2 | Q3 | Total |
|---|---|---|---|---|
| West | 120 | 135 | 150 | 405 |
| East | 100 | 110 | 125 | 335 |
| Central | 60 | 70 | 65 | 195 |
| Total | 280 | 315 | 340 | 935 |
Change the aggregate
Sigma sums numbers and counts text and dates by default. To change it, hover the value in the editor panel, click the caret, and pick from Set aggregate: Sum, Avg, Median, Min, Max, Count, CountDistinct and others, per the pivot table docs.
Add a second row level
Add Product Type under Region in Pivot rows and the rows nest. By default they show in one stepped column. Click Display as separate columns to give each level its own column. Click + or - next to a row to expand or collapse it.
Sigma's docs advise doing complex transformations in the flattened source table rather than in the pivot. Clean names and calculated fields belong upstream.
How do subtotals and grand totals work in a Sigma pivot table?
Grand totals appear whenever the pivot has values. Subtotals appear when there's more than one pivot row or pivot column. By default each total uses the same formula as the value, applied one level up, per Sigma's totals and subtotals page.
| What you want | Where |
|---|---|
| Hide all grand totals | Format > Totals, turn off Show grand totals |
| Hide all subtotals | Format > Totals, turn off Show subtotals |
| Hide only the Total column or Total row | Caret on the pivot column or row, Totals of column, clear Show grand total |
| Average instead of sum in a subtotal | Right-click a total cell, Column totals > Set aggregate |
| A custom formula for a total | Select a total cell and edit its formula in the formula bar |
| Show a child's totals at every parent level | Totals of column > Show values aggregated at > Every parent row |
| Rename "Total" | Double-click the total label and type a new one |
Two limits to know. If you rename a total, child elements and formulas still refer to the original name, such as Revenue (Grand Total). And if two crossing totals use different aggregates, such as an average and a max, the cells where they meet can be blank.
How do you show percent of total in a pivot table?
Add a calculated column in Values with + > Add new column, and use PercentOfTotal with a pivot mode.
PercentOfTotal(Sum([Revenue]), "row")
That gives each quarter's share of the region's total. In the synthetic data, West's Q3 is 150 of 405, or 37.0%. Other modes:
| Mode | Each cell as a share of | Example from the synthetic table |
|---|---|---|
"grand_total" (default) |
The grand total | West Q3: 150 / 935 = 16.0% |
"row" |
Its row total | West Q3: 150 / 405 = 37.0% |
"column" |
Its column total | West Q3: 150 / 340 = 44.1% |
"row_parent" |
Its parent row subtotal | Product Type within Region |
The aggregate must be a full formula, such as Sum([Revenue]), not a reference to an existing value column. Subtotal takes the same modes and returns the total itself, so Sum([Revenue]) / Subtotal(Sum([Revenue]), "row") matches the "row" example.
For a one-off calculation inside the pivot without changing the source table, Sigma also has ad hoc calculations.
Which formatting options matter for reports?
Four settings cover most report layouts. They're under the pivot's Format tab.
- Repeat row labels. With rows shown as separate columns, prints the parent label on every row, which is what people usually want in an Excel export.
- Empty cell display value. Fills blank cells with a value you choose, such as 0 or a dash.
- Swap rows with columns. The button next to Pivot rows flips the layout.
- Values position. With two or more values, drag the Values box above or below the pivot columns or rows to change how they nest.
You can also hide the fixed row and column headers under Table components. Sigma notes that exports with hidden headers keep that layout only in PDF and PNG.
When should you use a grouped table instead of a pivot table?
Use a grouped table when the data only groups in one direction, or when you need things a pivot doesn't do well. Sigma's docs say grouping columns in a table can approximate some pivot functionality, such as aggregating data for specific groups.
| Need | Pivot table | Grouped table |
|---|---|---|
| A second dimension across the top (quarters, regions) | Yes | No |
| Expand a group into its underlying rows | Maximize to see the flattened data | Yes, with + and - |
| Running totals or moving averages within a group | Not the documented route | Yes, window functions work best in grouped tables; see running totals in Sigma |
| Percent of row or column total | Yes, with pivot modes | Parent grouping only |
| Totals available to formulas | Row, column, parent and grand totals | Grand totals for each grouping |
| A report that looks like a printed list with group headers | Possible | Usually simpler |
In practice, a grouped table is the better choice for a list report with a header per group, and a pivot is the better choice for a matrix. Our post on merging cells in Sigma shows the same data both ways, and covers repeating row labels for export.
Check the flattened data
Maximize a pivot table (or press the space bar with it selected) to see the underlying flattened table. When a total looks wrong, that's where to look. Changes there flow into the pivot, and the other way round.
Pivot tables from Excel, Tableau and Power BI
Most pivot logic moves across cleanly. The usual work is in calculated fields and totals.
- Excel calculated fields become calculated columns in the source table or in Values. The Excel to Sigma functions cheat sheet covers the formula changes.
- Show values as % of row becomes
PercentOfTotalwith"row". - Tableau table calculations usually map to
PercentOfTotal,Subtotal, or window functions. See the Sigma functions list for the full set. - Power BI matrix visuals map to pivot tables, but measures need their filter context rebuilt.
If a migration involves dozens of matrix reports, see our Tableau to Sigma and Power BI to Sigma services, and how to validate a Sigma migration for checking totals against the old reports.
Frequently asked questions
How do I make a pivot table in Sigma?
Add a pivot table element, then add at least one column to Pivot rows or Pivot columns, and a column to Values. Numbers are summed by default.
How do I remove subtotals from a Sigma pivot table?
Select the pivot table, open Format > Totals, and turn off Show subtotals. To hide one level only, clear Show subtotals in that row's column menu.
How do I show percent of row total in a Sigma pivot table?
Add a calculated column under Values with PercentOfTotal(Sum([Revenue]), "row"). Use "column" for percent of column total, or "grand_total" for percent of the whole table.
What is the difference between a grouped table and a pivot table in Sigma?
A grouped table groups rows in one direction and can expand into the underlying rows. A pivot table adds a second dimension across the top and has more total types for formulas.
Can Sigma pivot tables repeat row labels?
Yes. With multiple pivot rows displayed as separate columns, open Format and select Repeat row labels.
What to do next
Rebuild one Excel pivot you use every month in Sigma, then compare its totals to the spreadsheet before you retire the file. If you have a set of pivot-heavy reports to move, book a call with me.
Part of the Sigma guides, a reading path through related articles.
Linus Tse
Founder of Greyfield Data. Built 400+ dashboards. Certified in Sigma, Snowflake, Tableau, and Power BI.
About Linus