
I was rebuilding a printed report in Sigma. On the page, each region shows once with its product rows underneath. In my Sigma table, the region repeated on every line.
There's no merge cells button. I went looking for one and almost wrote that Sigma can't do this. It can. You group the table.
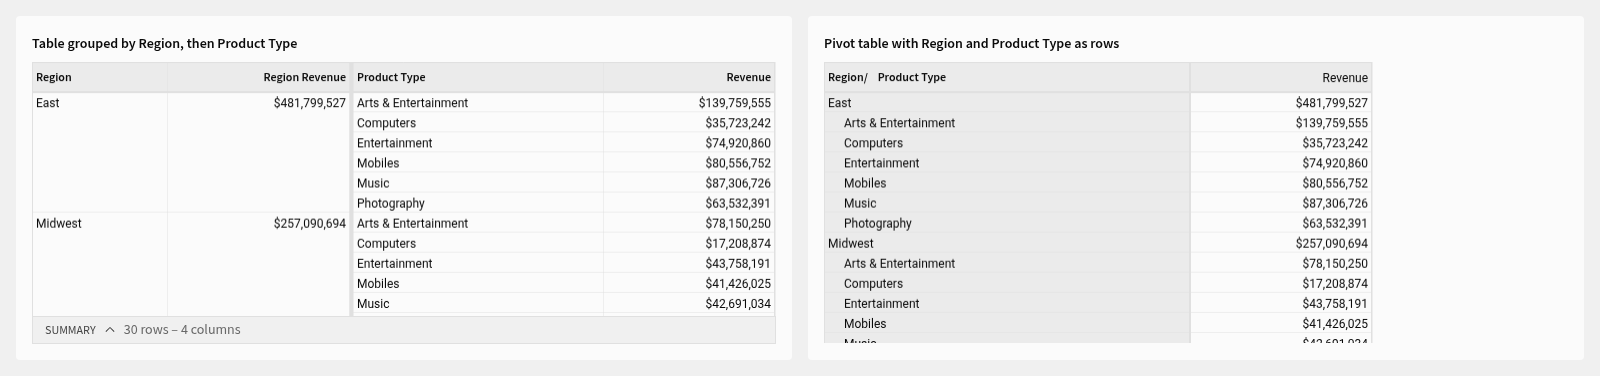
Both are built on Sigma's Plugs Electronics sample data with one measure, the sum of revenue.
Group the table
- Open the workbook in Edit mode and select the table.
- In the editor panel, under Groupings, click Add grouping and pick the column you want shown once, here
Region. - Sigma moves that column to the left, shows each value once, and adds an empty Calculations slot under the grouping. Click Add calculation and pick
Revenue. Sigma sums it. That's the number that sits next to the region label. - Add a second grouping for
Product Typeand give it its ownRevenuecalculation. Now each region shows once, and each product type shows once under it with its total. - Collapse the raw rows. Click the - next to the
Product Typecolumn header to collapse every product group at once, so only the group rows show. Readers can click + on any product to open its orders.
The label isn't a merged cell. It's the group header for those rows, so it moves with its rows when you sort or filter.
When a pivot table fits better
Use a pivot table when you also want a second dimension across the top.
- Add a Pivot table element from the same source.
- Drag
RegionandProduct Typeinto Pivot rows, andRevenueinto Values. - By default the rows nest in a single stepped column, as on the right in the screenshot. To give each row level its own column, click Display as separate columns in the editor panel. It appears once you have two pivot rows.
To break revenue out by month across the top, drag
Monthinto Pivot columns as well. - In that layout the parent label prints once per group. If you want it on every row instead, usually for exports to Excel, open the Format tab and tick Repeat row labels.
If the real problem is cramped rows
Some of the "how do I merge cells" searches are really "the table looks crowded". A bigger cell font won't fix that.
- Select the table, open Format in the editor panel.
- Under Table style, switch Preset from Spreadsheet to Presentation. Rows get taller and cell spacing goes to Large.
- Or keep Spreadsheet and change Cell spacing on its own: Extra small, Small, Medium, or Large.
The same defaults can be set for every table in a workbook from Workbook settings, and as the default for new workbooks in a theme under Administration.
If you build workbooks as code
Workbooks as code is a beta you have to ask Sigma to turn on; the endpoints below work once it's enabled.
This is the grouped table element that produced the left half of the screenshot. Each grouping level needs its own calculation column id. I reused one id across two levels first and got Duplicate column or folder reference back. That's from the spec verify endpoint in the beta.
- id: grouped
  kind: table
  source: {elementId: sales, kind: table}
  columns:
  - {id: g-region, formula: '[Sales/Region]', name: Region}
  - {id: g-ptype, formula: '[Sales/Product Type]', name: Product Type}
  - id: g-rev-r
    formula: Sum([Sales/Revenue])
    name: Region Revenue
    format: {kind: number, formatString: '$,.0f'}
  - id: g-rev-p
    formula: Sum([Sales/Revenue])
    name: Revenue
    format: {kind: number, formatString: '$,.0f'}
  groupings:
  - {id: grp-region, groupBy: [g-region], calculations: [g-rev-r]}
  - {id: grp-ptype, groupBy: [g-ptype], calculations: [g-rev-p]}
  order: [g-region, g-ptype, g-rev-r, g-rev-p]
And the pivot on the right:
- id: pivot
  kind: pivot-table
  source: {elementId: sales, kind: table}
  columns:
  - {id: pv-region, formula: '[Sales/Region]', name: Region}
  - {id: pv-ptype, formula: '[Sales/Product Type]', name: Product Type}
  - id: pv-rev
    formula: Sum([Sales/Revenue])
    name: Revenue
    format: {kind: number, formatString: '$,.0f'}
  values: [pv-rev]
  rowsBy:
  - {id: pv-region}
  - {id: pv-ptype}
I'm a few months into Sigma after years of Tableau and Power BI, and the grouping panel is the thing I kept walking past. If you know a cleaner way to get the report layout, I'd like to hear it.