How to build a DTC data practice in 2026 (white paper)
A free white paper for DTC founders and CFOs on getting more from every ad dollar and more from the same team, plus the data foundations to do both.

Written by Linus Tse, founder of Greyfield Data
· 5 min read
On this page 8 sections
A data practice should pay for itself twice: in ad dollars that go where they earn the most, and in hours your team stops spending on exports, reconciling, and rebuilding the same report. I wrote down how we set that up for DTC brands in a 15-page white paper.
You can get the white paper (PDF) and put a number on your own reporting hours with the reporting time calculator. For the tool choices (warehouse, loaders, BI), see The DTC Data Stack.
Key takeaways
- The biggest efficiency gain in most DTC brands is in the ad budget. A channel's average return says it has worked; what the next $10K brings back is what should decide the budget.
- The second gain is time. Data that loads itself every morning, and AI assistants people can ask directly, turn two-week questions into minutes.
- Definitions and a data map are the groundwork, not the goal. Write each metric once so nobody rebuilds or re-argues it.
- A dashboard nobody opens saves nothing. Build the first page around yesterday and the one change that matters.
- The cheapest data team is rarely the cheapest outcome. You need one that saves ad dollars and hours, not one that adds reports.
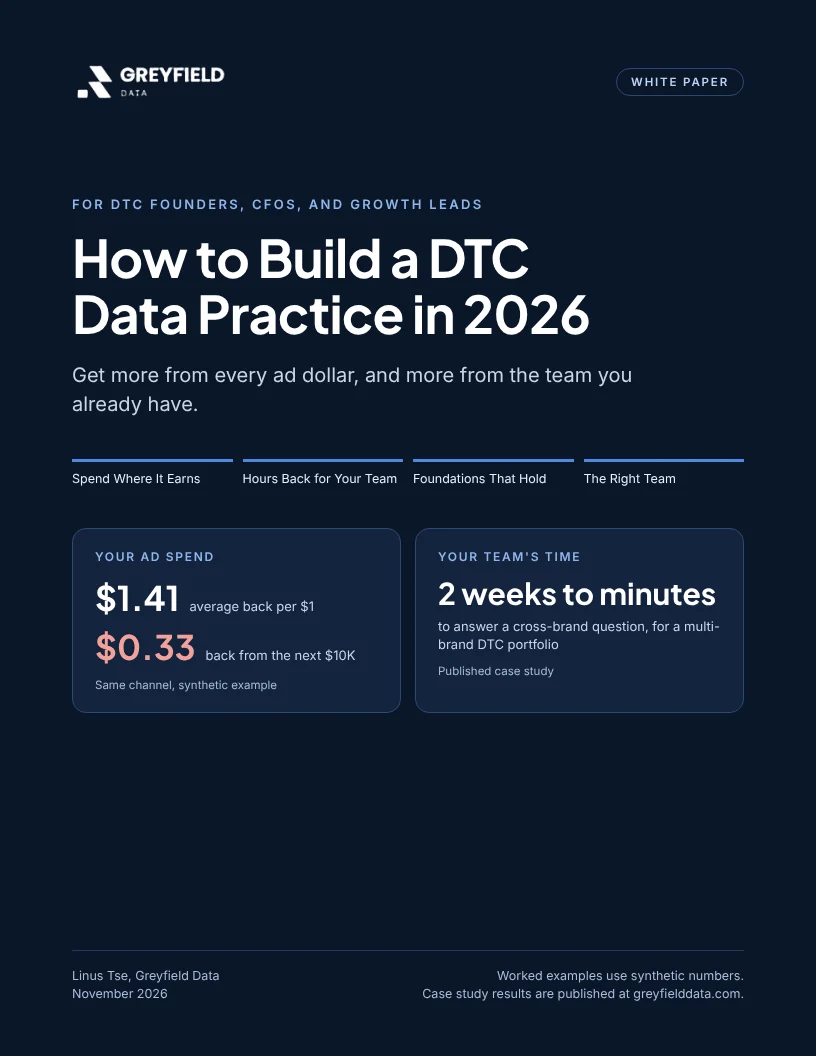
How to Build a DTC Data Practice in 2026: more from every ad dollar, and more from the team you already have.
Who is the white paper for?
It is for founders, CFOs, and heads of growth at DTC brands that sell on their own site and on Amazon, often with subscriptions, TV, and podcasts in the mix. It assumes you already have dashboards and want more out of the budget and the team behind them.
Worked examples use synthetic numbers. Results come from our published case studies.
Where should the next ad dollar go?
To the channel where the next dollar brings back the most, which is often not the channel with the best average. Channels saturate: search runs out of people searching, so more budget buys the same searchers at higher bids.
| Channel (synthetic) | Average back per $1 | Next $10K, back per $1 |
|---|---|---|
| Google search | $1.41 | $0.33 |
| Podcast | $1.27 | $1.11 |
| TV | $1.13 | $0.89 |
| Meta | $1.09 | $0.44 |
"Back per $1" is first-year profit per dollar of ad spend. In the paper's illustration, a $50M brand that moves $1.25M from a $0.33 channel to a $1.11 channel gains about $975K a year in first-year profit, before allowing for returns falling as spend rises. That is an illustration, not a client result. Average vs marginal return on ad spend explains the method.
How do you give your team its hours back?
Load the data every morning, define each metric once, and let people ask their own questions. In our case studies, that turned two-week questions into minutes.
| Case study | Before | After |
|---|---|---|
| Multi-brand DTC portfolio | 2 weeks to answer a cross-brand question | Minutes |
| Brokerage daily report | 5 hours a week producing the report | About 30 minutes |
| National legal organization | 2 weeks to answer a leadership question | 20 minutes |
The paper lists where reporting hours usually go: exports, reconciling two reports that disagree, waiting in an analyst's queue, and fixing what broke. How much time does your team lose to reporting? works through the math.
What foundations does this need?
Two pieces of groundwork, written once so nobody redoes them. The first is a short set of metric definitions, each with an owner and a version. The second is a data map: each business idea (customer, order, ad spend, channel credit), the systems that feed it, and the field they are matched on.
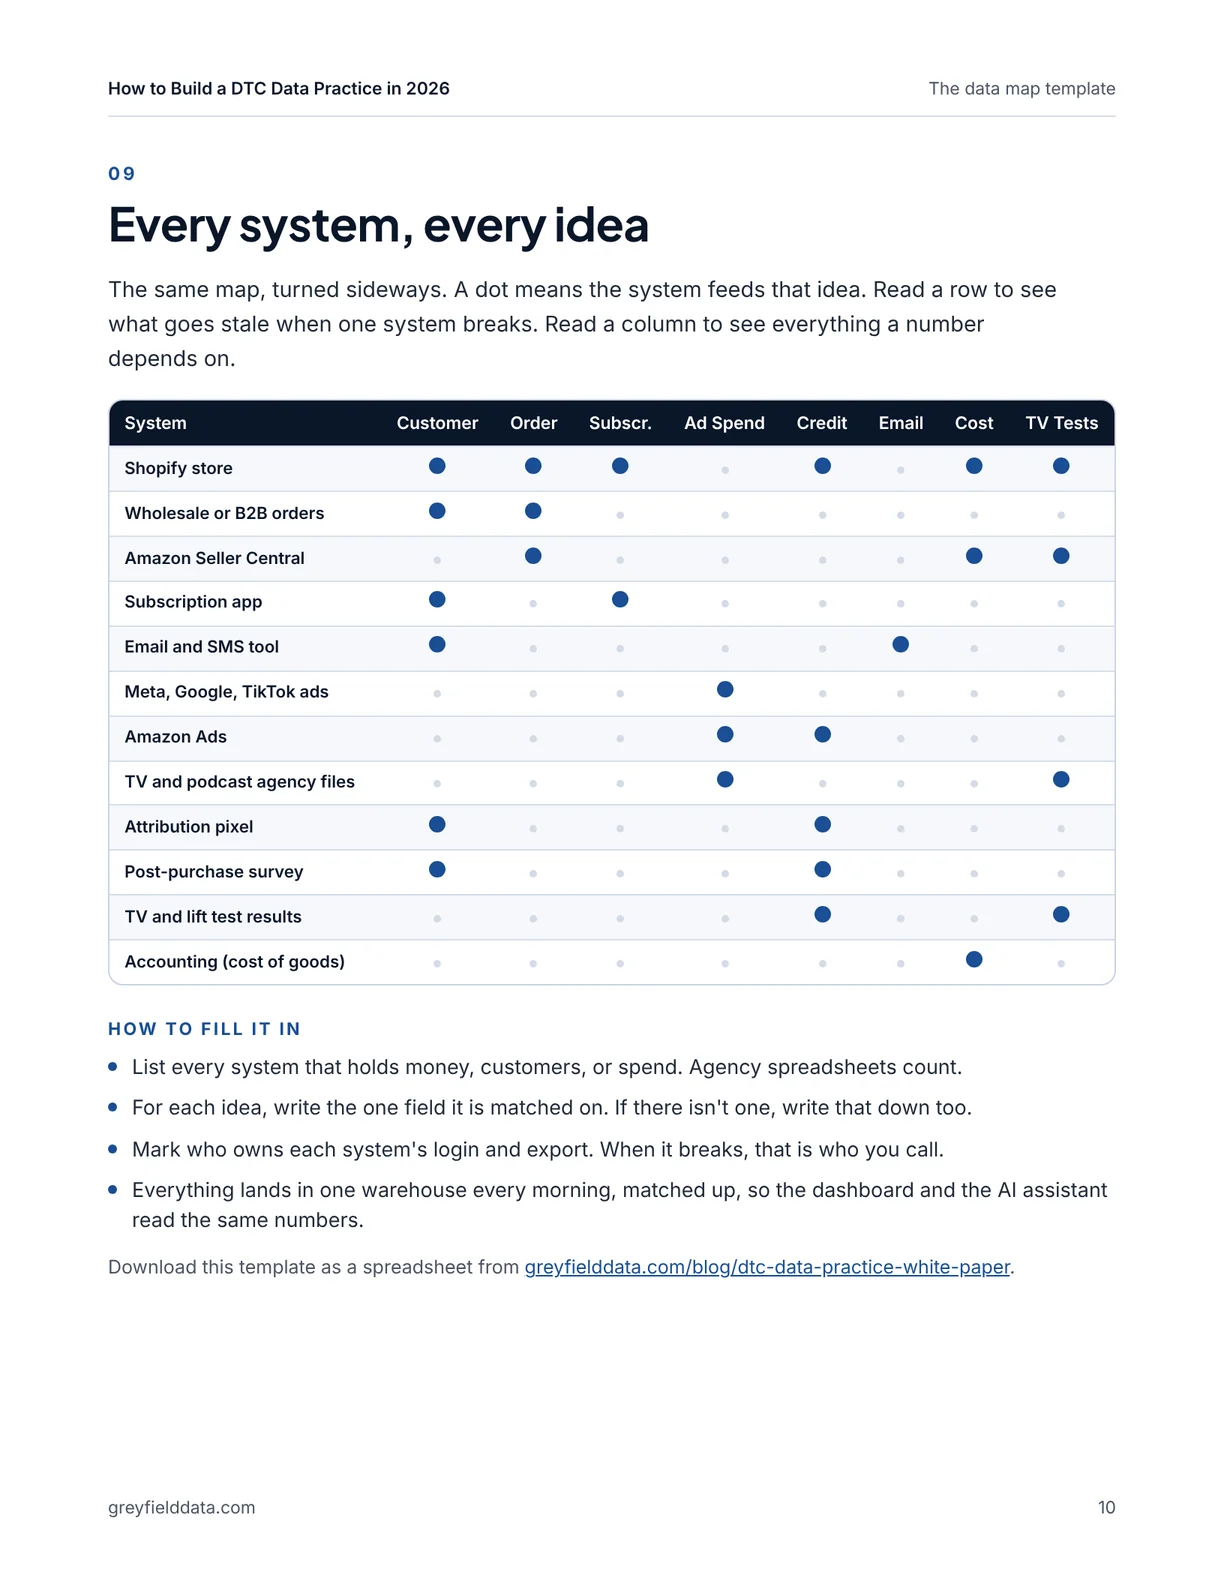
You can download the data map template (CSV). Two gaps belong on every DTC map: Amazon shares no customer IDs, and TV has no clicks. Why AI gives different answers to metric questions shows the rework that missing definitions cause.
Why is cheap data the expensive option?
Because a cheap team builds what you ask for and leaves your people to work out what it means. The paper compares that with a business data engineer who builds and runs the data and says what to do with it. 10 mistakes to avoid when building a data team covers the team side in more depth.
Frequently asked questions
What is a data practice?
It is the people, data, and habits that turn your numbers into better spend decisions and fewer hours spent on reports. Tools are part of it, but most of the value is in what changes week to week.
How do you measure whether a data practice is working?
Track four things from the start: budget moved on next-dollar returns, hours a week spent producing reports, time to answer a new question, and who opens the dashboard each week.
Do I need a full-time data engineer?
Often not. Someone still has to own loading, modeling, definitions, and fixes, and for many DTC brands that is a heavy setup followed by light ongoing support. Do DTC brands need a data engineer? goes through it.
Where should a DTC brand start?
Start where the money and hours are: estimate the next-dollar return for your biggest channels and count the hours your team spends on reports. The paper's checklist on page 14 shows what to fix next.
What to do next
Get the white paper, then run your numbers through the reporting time calculator. If you'd rather talk it through, book a call and bring last month's spend by channel.
Part of the Ecommerce reporting guides, a reading path through related articles.
Linus Tse
Founder of Greyfield Data. Built 400+ dashboards. Certified in Sigma, Snowflake, Tableau, and Power BI.
About Linus