How should a Shopify brand schedule its daily data pipeline?
A real DTC brand's daily data schedule, built backward from a 7:00 AM reporting cutoff, with retries, checks and backups. Free Google Sheets template.

Written by Linus Tse, founder of Greyfield Data
· 12 min read
On this page 10 sections
Schedule a Shopify brand's data pipeline backward from one deadline: the time morning reports must be ready. Put slow, low-priority loads overnight, run the main store syncs in the last few hours before the cutoff, and make the BI refresh wait for readiness checks. Plan at least two ways to recover, and write the whole schedule down in one place your team can read.
We set up and run schedules like this as part of our DTC data warehouse work, usually on Snowflake. The schedule below is the real one I run for a DTC apparel brand, with the clock times shifted to keep the brand anonymous. Copy the free Google Sheets template to build your own.
Key takeaways
- Build the schedule backward from a fixed reporting cutoff, such as 7:00 AM. Every job then has a deadline and a known amount of time to retry.
- Chain each rebuild to the load before it, instead of guessing a start time. Make the BI refresh wait for readiness checks.
- Sync Shopify more than once a day. Small incremental runs finish faster, and a second run before the cutoff is a built-in retry.
- Layer recovery: a retry before the cutoff, a late-report check right after it, a targeted retry, and a backup that runs without the main server.
- Keep the schedule in one sheet with a "last updated" date and a change log, so business users can see what runs when and what changed.
Why write the data schedule down?
Because you can't fix a schedule you can't see. When I took over this brand's data stack, things were always breaking. Jobs ran from one-off scripts, a couple of virtual machines, GitHub Actions and each tool's own scheduler, each on its own clock.
Nothing was written down in one place. When a report was wrong in the morning, the first hour went to working out what was supposed to have run, and when.
So before changing any jobs, I listed every one of them in a single sheet: what it does, when it starts, what it waits for, and what happens if it fails. The sheet showed which jobs were duplicates, which ran in the wrong order, and where there was no time left to retry. Then I moved the jobs to match it.
It changed things for the business users too. Finance and ops can open the schedule and see what runs when, what the cutoff covers, and what changed recently. When something is late, everyone is looking at the same page.
In my experience, very few data teams write their schedule down like this. The timing lives in five tools, a few people's heads and an old Slack thread. That works until something breaks at 6:20 AM and nobody can say what depends on what.
Why does a reporting cutoff change how you design everything?
A cutoff turns "runs overnight" into a deadline every job has to meet. In this schedule, morning reports are ready by 7:00 AM Eastern, and every job has to answer three questions:
- What has to finish before it can start?
- How long does it usually take, and what happens if it takes twice as long?
- If it fails, is there still time to try again before 7:00?
Once you ask those, you schedule around dependencies and slack instead of round numbers. You also get a clear definition of late: anything unfinished after 7:00. The rest of the design makes that rare, and makes sure someone knows when it happens.
If your reports already break in a shared spreadsheet, start with why Google Sheets marketing dashboards keep breaking.
What does a daily DTC data schedule look like?
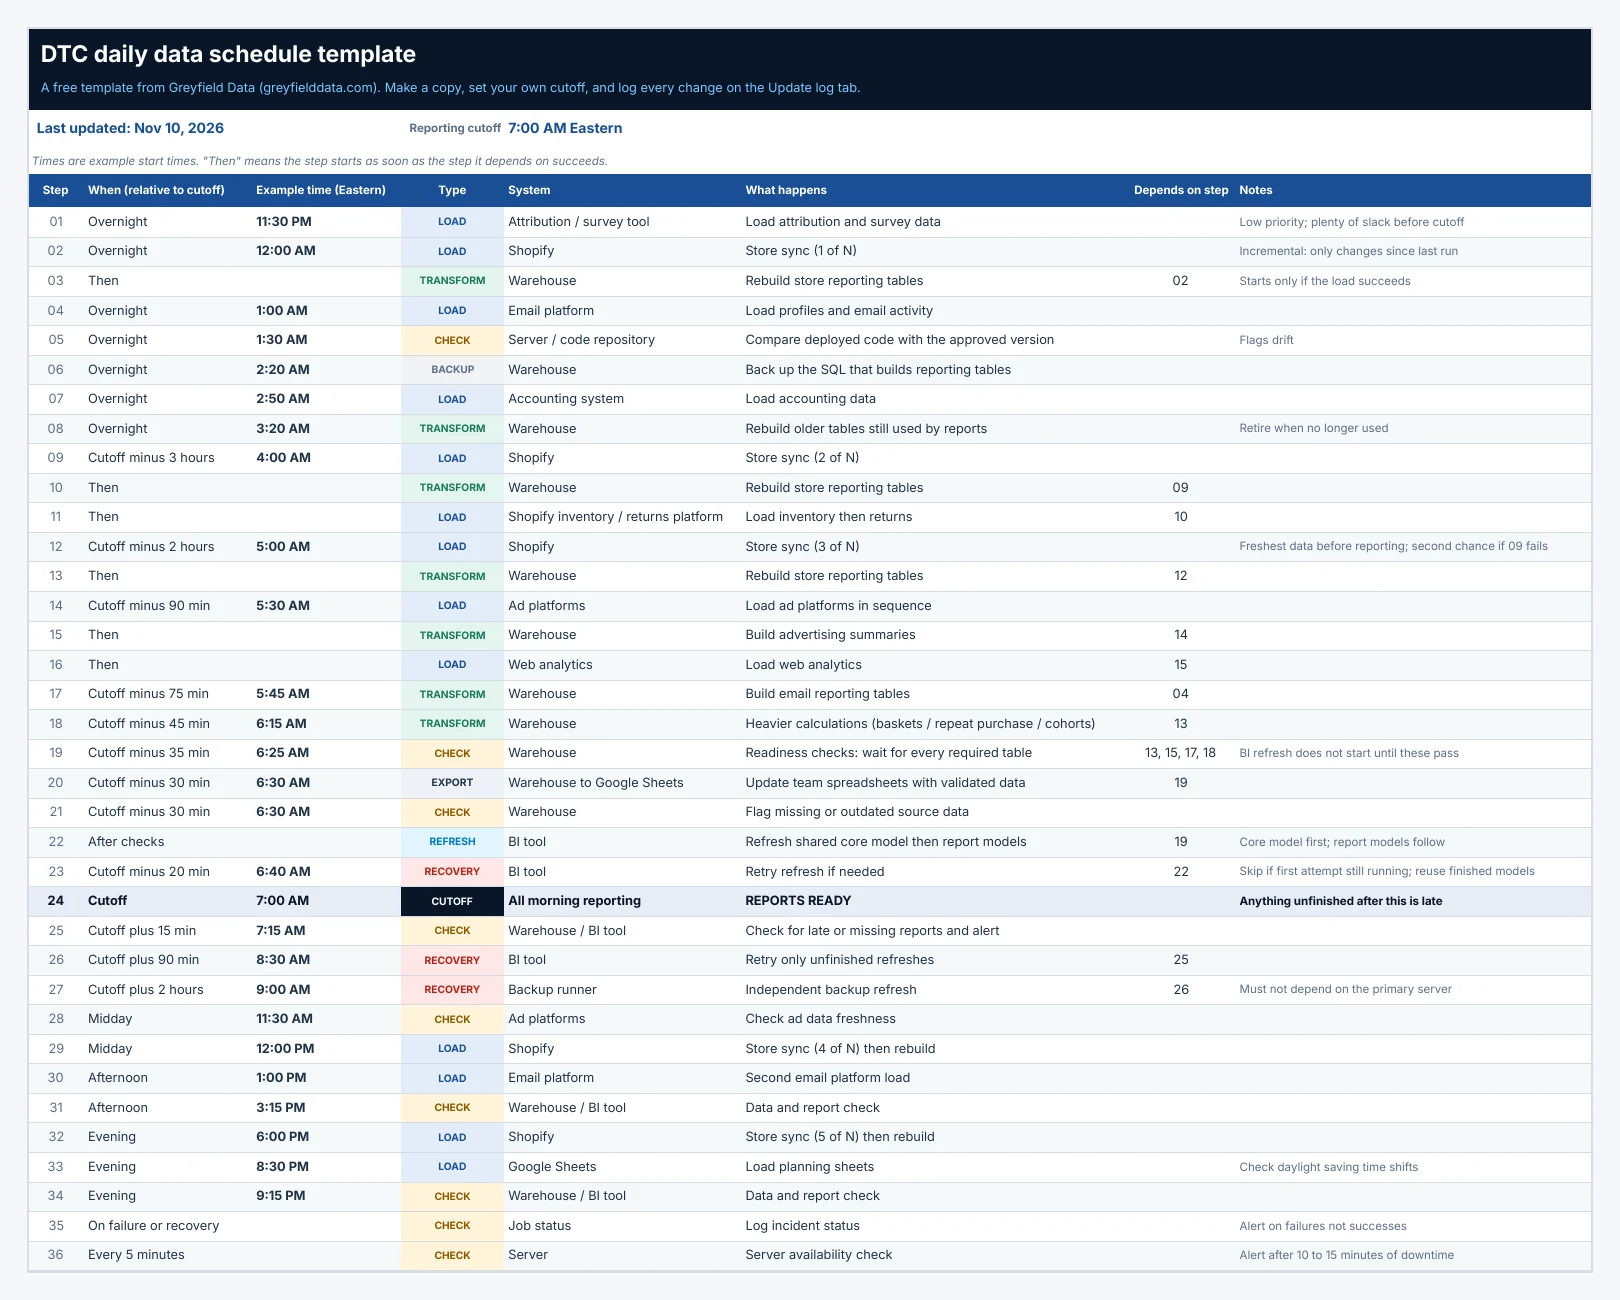
It runs from a few overnight loads, through a busy two hours before the cutoff, to a handful of checks during the day. "Then" means a step starts as soon as the step it depends on succeeds.
| Time (Eastern) | Type | What happens |
|---|---|---|
| 11:30 PM (night before) | Load | Attribution and post-purchase survey data |
| 12:00 AM | Load, then transform | Shopify sync (1 of 5), then rebuild Shopify reporting tables |
| 1:00 AM | Load | Klaviyo profiles and email activity (1 of 2) |
| 1:30 AM | Check | Confirm the code on the server matches the approved version |
| 2:20 AM | Backup | Save a copy of the SQL that builds the reporting tables |
| 2:50 AM | Load | Accounting data |
| 3:20 AM | Transform | Rebuild older tables that existing reports still use |
| 4:00 AM | Load, then transform | Shopify sync (2 of 5), rebuild, then inventory and returns |
| 5:00 AM | Load, then transform | Shopify sync (3 of 5) and rebuild |
| 5:30 AM | Load, then transform | Ad platforms in sequence, ad summaries, then Google Analytics |
| 5:45 AM | Transform | Klaviyo reporting tables |
| 6:15 AM | Transform | Basket and repeat purchase calculations |
| 6:25 AM | Check | Wait until every required table is ready |
| 6:30 AM | Export and check | Update marketing Google Sheets; flag missing or stale sources |
| After checks | Refresh | Power BI: shared core model first, then the report models |
| 6:40 AM | Recovery | Retry Power BI if needed |
| 7:00 AM | Cutoff | Morning reports ready |
| 7:15 AM | Check | Look for late or missing reports |
| 8:30 AM | Recovery | Retry only the refreshes that didn't finish |
| 9:00 AM | Recovery | Independent backup refresh |
| 11:30 AM | Check | Ad data freshness check |
| 12:00 PM | Load, then transform | Shopify sync (4 of 5) and rebuild |
| 1:00 PM | Load | Klaviyo (2 of 2) |
| 3:15 PM | Check | Data and report check |
| 6:00 PM | Load, then transform | Shopify sync (5 of 5) and rebuild |
| Evening | Load | Product launch plan from a Google Sheet |
| 9:15 PM | Check | Data and report check |
| Every 5 min | Check | Is the server up? |
Chain loads and rebuilds instead of timing them
The Shopify reporting tables rebuild after the Shopify load succeeds, not at a guessed time afterward. Inventory waits for Shopify, and returns wait for inventory. Chaining removes a whole class of "the report ran on half-loaded data" problems. For how raw, cleaned and reporting tables fit together, see bronze, silver and gold with one order.
Use the quiet hours for housekeeping
Between 1:30 and 3:30 AM, the schedule checks for code drift, backs up the table definitions and rebuilds older tables. None of that is urgent, so it runs where it can't compete with the morning rush.
Make the BI refresh wait for readiness checks
At 6:25 AM, the refresh doesn't simply start. It checks that its source tables are ready. The shared core model refreshes first, and the report models follow: about 15 models in a set order, instead of 15 separate timers hoping the data is there.
Watch daylight saving time
One evening load starts an hour earlier in winter than in summer, because its scheduler runs on a fixed clock. If your tools schedule in UTC, write down which jobs move when the clocks change.
How often should Shopify sync each day?
Often enough that the data is fresh when people use it, and with a spare run before the cutoff. This brand syncs Shopify at 12:00 AM, 4:00 AM, 5:00 AM, 12:00 PM and 6:00 PM.
- Smaller loads are easier loads. Each run picks up only what changed since the last one. Five modest runs are less likely to time out than one large one, and a failed run has less to redo.
- Two chances before the cutoff. The 4:00 and 5:00 runs both land before reporting. The 5:00 run adds fresh data right before the refresh, and it's a second chance if the 4:00 run has trouble.
- People look at the data more than once a day. Midday and evening runs keep orders and customers current for anyone checking in the afternoon.
The same pattern works for other sources. For the details of resumable incremental loads, see watermarks and rate limits in an incremental Klaviyo load.
How do you catch pipeline failures before the business does?
Layer the recovery so that every failure is retried automatically and anything still late triggers an alert. Every pipeline fails eventually: an API is slow, a password expires, a server restarts. The goal is for the data team to know first.
| Time | Step | What it does |
|---|---|---|
| 6:40 AM | Retry | Reruns a failed refresh. Skips if the first attempt is still running, and reuses models that already finished. |
| 7:15 AM | Late-report check | Fifteen minutes after the cutoff, flags late or missing reports, before a finance lead finds them at 8:30. |
| 8:30 AM | Targeted retry | Retries only unfinished refreshes, and only once their data is ready. |
| 9:00 AM | Independent backup | Runs the refresh without the primary server, so it still works when the main server is what broke. |
Around those sit the continuous checks. A server check runs every 5 minutes and alerts after roughly 10 to 15 minutes of downtime. Failed jobs and recoveries are logged as incidents. Checks at 3:15 PM and 9:15 PM catch stale data outside the morning window, and a late-morning check watches the ad data.
Alerts go out on failures, not on every success. People stop reading alerts that fire every day. For what the morning report itself should show, including data freshness, see what belongs in a daily scorecard.
Does cleaning up old jobs make a pipeline more reliable?
Yes. Every job you don't need is another thing that can fail, alert or slow the morning down. Some of the most useful reliability work here was removing things.
Data stacks pile up connections: an old sync for a one-off analysis, a second copy of a feed in another tool, ad platforms the brand no longer spends on. I turned off 15 old or duplicate data connections and retired unused advertising imports, keeping the historical data. I also combined related jobs, so fewer separate schedules run in a clearer order.
Speed matters for the same reason. I made a key reporting calculation about 80% faster, from roughly 13 minutes to 3 minutes in a like-for-like test with the same results. In a window that ends at 7:00 AM, ten minutes is room for a retry. Slow, expensive runs often have a cause you can find, as in a Snowflake cost spike from query compilation.
How do you build your own schedule from the template?
Start by listing what already runs, then fit it to your cutoff. The template has every load, rebuild, check, refresh, retry and backup, with its time, what it depends on and why it's there. Each time is written relative to the cutoff, so the rest of the day follows from yours.
- List every job you have today, wherever it runs, before changing anything.
- Set your cutoff and put each job on the timeline, with what it depends on.
- Look for the problems the sheet makes visible: duplicates, jobs in the wrong order, and no room for a retry.
- Move the jobs to match the sheet, not the other way around.
- Share it with your business users, and log every change.
The piece most schedules leave out is a "last updated" date and a change log: the date, what changed and who changed it. A schedule is only useful if people trust that it's current. When a report is late, the first question is almost always "did something change?", and the log answers it.
| When | Type | Step |
|---|---|---|
| Overnight | Load | Slow or low-priority sources (accounting, attribution) |
| Overnight | Check and backup | Code drift check; back up table definitions |
| Cutoff minus 3 hours | Load, then transform | Main store sync and rebuild |
| Cutoff minus 2 hours | Load, then transform | Second store sync and rebuild |
| Cutoff minus 90 min | Load, then transform | Ad platforms, analytics, email |
| Cutoff minus 45 min | Transform | Heavier calculations (cohorts, baskets) |
| Cutoff minus 35 min | Check | Readiness checks on every source |
| After checks | Refresh | Shared BI model first, then report models |
| Cutoff minus 20 min | Recovery | First retry |
| Cutoff | Cutoff | Reports ready |
| Cutoff plus 15 min | Check | Late or missing report check, with alert |
| Cutoff plus 90 min | Recovery | Retry unfinished work only |
| Cutoff plus 2 hours | Recovery | Independent backup path |
| Midday and evening | Load and check | Extra store syncs; data and report checks |
| Every 5 min | Check | Server availability |
If you're still deciding which sources belong in the warehouse at all, start with the sources most DTC brands end up needing and the data stack quiz.
Frequently asked questions
How often should Shopify data sync to a data warehouse?
At least once shortly before your morning reporting cutoff, with a second run as a backup. This brand syncs five times a day: three runs overnight and early morning, one at midday and one in the evening. Frequent incremental syncs are smaller, faster and easier to rerun.
When should Power BI refresh each morning?
After every source table it needs is ready, with enough time left to retry once before your cutoff. Microsoft's documentation says shared capacity allows up to eight scheduled refreshes a day, and Premium capacity up to 48, so plan your retries within that limit.
What happens if a data pipeline fails overnight?
In a well-designed schedule, it's retried automatically, and an alert goes out if it's still late at the cutoff. This schedule retries 20 minutes before the cutoff, checks for late reports 15 minutes after, retries unfinished work after 90 minutes, and runs an independent backup after 2 hours.
What is a readiness check in a data pipeline?
A query that confirms a table was loaded and rebuilt today before anything downstream uses it. It usually checks the latest load time or the newest date in the table. If it fails, the BI refresh waits instead of publishing yesterday's numbers.
How do you handle daylight saving time in a pipeline schedule?
Write down which jobs run on a fixed UTC clock and which follow local time. Jobs on UTC start an hour earlier or later in local time when the clocks change. Check that their dependencies and your cutoff still line up after each change.
What to do next
Copy the template and list every job you run today. To see how much time broken reports cost your team, try the reporting time calculator. For the full build, from warehouse to reports, read why reliable reporting takes time and the DTC data practice white paper. If you want a schedule like this running for your brand, book a call.
Part of the Ecommerce reporting guides, a reading path through related articles.
Linus Tse
Founder of Greyfield Data. Built 400+ dashboards. Certified in Sigma, Snowflake, Tableau, and Power BI.
About Linus