The ecommerce data stack: how to choose tools and plan the build (free white paper)
A free white paper for DTC and omnichannel brands on choosing ecommerce data stack tools by stage, plus a five-phase plan with owners and checks.

Greyfield Data
In this article 10 sections
Choosing an ecommerce data stack is two decisions: which tool fills each layer, and in what order to build it. I wrote both down in an 18-page white paper for DTC and omnichannel consumer brands, based on the stacks I build for clients and the sourced comparisons on this site.
You can download the white paper (PDF), or get a stack for your own brand in a few minutes with the free ecommerce data stack quiz, which applies the same framework to ten answers.
Key takeaways
- An ecommerce data stack does seven jobs: sources, ingestion, warehouse, modeling, semantic layer, BI, and activation. Packaged analytics tools bundle several of them with their own definitions.
- Choose by stage, not by logo. A single-channel Shopify brand, a brand on Amazon and TikTok Shop, and a brand with wholesale or retail need different stacks.
- Packaged tools such as Triple Whale, Polar, Peel, and Daasity are the right first step when their definitions fit. A warehouse earns its cost when finance needs numbers that tie out across channels.
- Build in five phases, each with deliverables, owners, acceptance checks, and risks: audit and definitions, orders and margin, marketing and CAC, retention and customer view, forecasting and activation.
- Timeline and cost depend on sources, history, data quality, and how fast owners agree on definitions, so the paper names those drivers instead of quoting numbers.
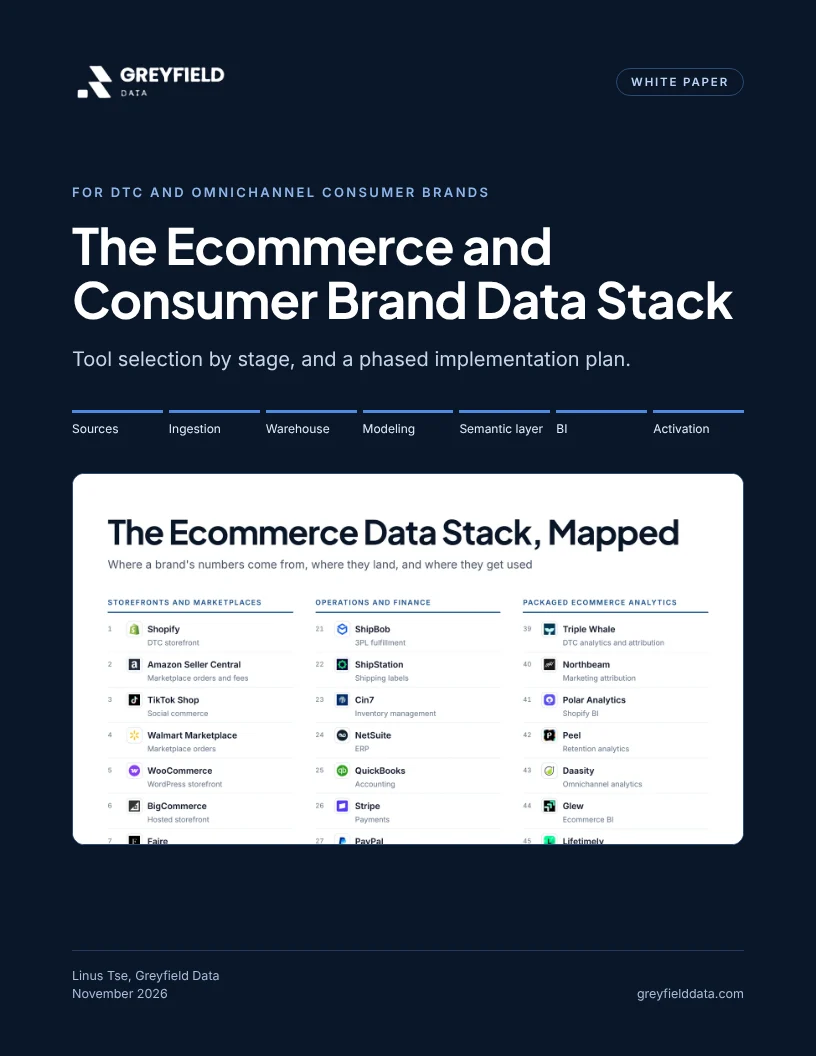
The Ecommerce and Consumer Brand Data Stack: tool selection by stage, and a phased implementation plan.
Who is the white paper for?
It is for founders, finance leads, growth leads, and the first data hire at consumer brands that sell physical products online. It assumes someone has asked a question your current reports cannot answer, or answers three different ways.
What are the layers of an ecommerce data stack?
There are seven, and every stack covers them whether you buy or build. The ecommerce data stack map places 57 tools on them, and the general data stack map covers the layers beyond ecommerce.
| Layer | Job | Common tools |
|---|---|---|
| Sources | Create orders, refunds, fees, spend, and costs | Shopify, Amazon, TikTok Shop, Klaviyo, Recharge, NetSuite |
| Ingestion | Copy source data into the warehouse | Fivetran, Airbyte, Daton, Funnel, custom code |
| Warehouse | Store everything in one place | BigQuery, Snowflake, Databricks |
| Modeling | One order, customer, and margin model | dbt, prebuilt vendor models |
| Semantic layer | Define each metric once | A metric dictionary, Snowflake semantic views, a BI model |
| BI | Show the numbers | Looker Studio, Sigma, Power BI, Metabase |
| Activation | Send audiences back to marketing tools | Hightouch, Census, native syncs |
Which stack fits which stage?
The paper gives a recommended stack for three stages, with the signals that tell you which one you are in.
| Stage | Start with | Warehouse stack when you build |
|---|---|---|
| Single-channel Shopify | Shopify Analytics, then one packaged tool: a profit app, Triple Whale, Peel, or Polar | Fivetran or Airbyte, BigQuery or Snowflake, dbt, Looker Studio or Sigma |
| Shopify plus Amazon and TikTok Shop | Polar or Peel if Shopify leads; Sellerboard if Amazon leads | Daton or Fivetran, BigQuery or Snowflake, dbt with a SKU map and fee models, Sigma or Power BI |
| Online plus wholesale and retail | Daasity, if its omnichannel models fit | Fivetran plus custom code for retailer files, Snowflake, dbt, Sigma or Power BI, Hightouch or Census |
Each packaged tool in the paper links to a sourced comparison, such as Polar vs a custom warehouse and Daasity vs a custom warehouse, which also say where the packaged tool is the better choice.
How should you choose an ingestion tool?
Source by source, with four questions: does a managed connector cover the tables you report on, can your team run servers, is per-row pricing a problem at your volume, and is the source mostly marketing data. Most brands end up with two or three answers. The paper keeps this short; the ecommerce data ingestion tools guide compares Fivetran, Airbyte, Daton, Funnel, and custom code in depth.
Why does the metric dictionary come first?
Because most reporting problems are definition problems. "Revenue" is at least four metrics in an ecommerce business, and the dictionary gives each one a grain, a date, sources, an owner, and a tie-out check. It is the cheapest layer in the stack and the one every other tool reads. The ecommerce semantic layer post is the dictionary itself, with a CSV template.
What are the five implementation phases?
Each phase produces reports people use and ends with acceptance checks, so you move on when the numbers tie out rather than when a date arrives.
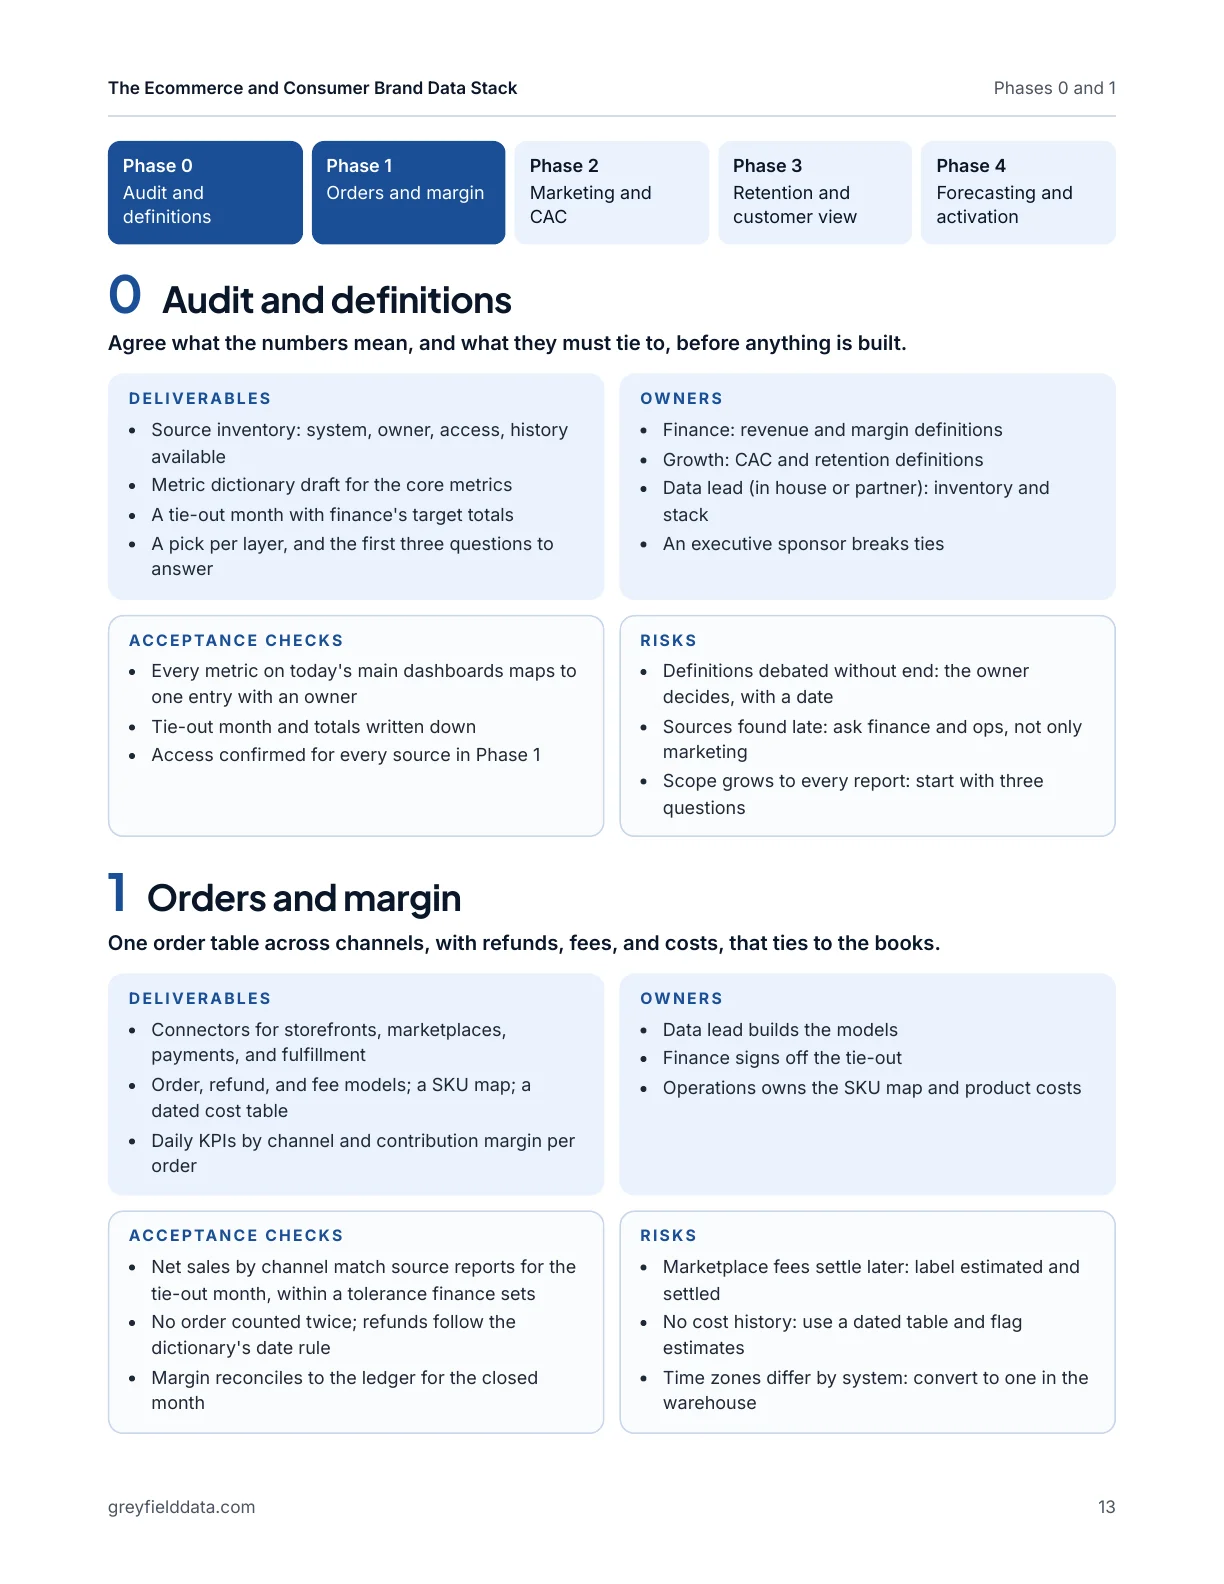
| Phase | Answers | Done when |
|---|---|---|
| 0. Audit and definitions | What do our numbers mean, and where do they come from? | Every core metric has a written entry and an owner |
| 1. Orders and margin | What did we sell and make, by channel? | Net sales and margin tie to the books for a closed month |
| 2. Marketing and CAC | What does a new customer cost? | Spend ties to platform billing; CAC uses the same new-customer count |
| 3. Retention and customer view | Who comes back, and what are they worth? | One ID per person; cohorts count only eligible customers |
| 4. Forecasting and activation | What will we sell, and who should we target? | Forecasts backtested; synced audiences match the warehouse |
The paper also includes a readiness checklist, a table for deciding which phase to start with, and nine common failure modes, from building dashboards before definitions to syncing audiences before identity is trusted.
Why are there no timelines or prices in it?
Because they vary too much between brands to be useful as numbers. Instead, the paper lists what drives them: how many sources you have and whether connectors exist, how much history you need, data quality, how quickly metric owners decide, connector and warehouse usage, BI seats, and who maintains the models after launch. Why reliable ecommerce reporting takes time explains the slow parts.
Frequently asked questions
What is an ecommerce data stack?
It is the set of tools that collects, moves, stores, defines, and reports on a brand's data: sales channels and other sources, connectors, a warehouse, models, a metric layer, BI, and optionally tools that send audiences back to marketing.
Do I need a data warehouse for a Shopify store?
Not at first. Shopify's reports or a packaged tool are often enough for one channel. A warehouse earns its place when you sell on several channels, need margin after every fee, or need finance and marketing to agree.
Which phase should I start with?
Start with Phase 0 if your teams do not agree on last month's revenue, and Phase 1 if they do and raw data is not yet modeled. The quiz works it out from your answers.
Is the white paper free?
Yes. It is a PDF with no form to fill in. Screenshots in it use synthetic data for made-up brands.
What to do next
Download the white paper, then take the ecommerce data stack quiz to see one pick per layer for your brand. If you would rather talk it through, book a call and bring the reports you use today.
Part of the Ecommerce reporting guides, a reading path through related articles.
Related
The 10 best ecommerce data consultancies in 2026
Ten data and analytics consultancies for DTC, Shopify, and marketplace brands, compared on warehouse builds, attribution, and margin and retention reporting.
How to choose a data ingestion tool for ecommerce: Fivetran, Airbyte, Daton, Funnel, and custom code
Compare Fivetran, Airbyte, Daton, Funnel, Portable, Stitch, and custom code for Shopify, Amazon, TikTok Shop, Klaviyo, and ads, and pick one per source.
Ecommerce semantic layer: a metric dictionary for gross sales to LTV
Definitions for gross sales, net sales, net revenue, contribution margin, CAC, repeat rate, and LTV, with grain, date, sources, owner, and a free template.