What determines the cost of a Power BI or Tableau migration to Sigma?
Understand the work that drives Sigma migration costs, from shared models and data preparation to calculation fixes, validation, and rollout.

Greyfield Data

In this article 8 sections
The cost of a Power BI or Tableau migration to Sigma depends on the work required to reproduce the reporting, not just the number of dashboards. Shared models can reduce repeated effort. Data preparation, unusual calculations, permissions, and delivery requirements can add work that a dashboard count misses.
A useful estimate separates those activities and shows its assumptions. This guide explains how to build that estimate from a representative pilot without inventing a universal price per report.
Separate project effort from recurring platform costs
Treat the migration project and the future operating bill as separate estimates. Project work includes discovery, data preparation, model and report rebuilding, validation, deployment, and handover.
Recurring costs can include Sigma licensing, the connected data platform, ingestion services, and ongoing support. Obtain the relevant vendor quote and measure the intended workload. This article does not provide current vendor prices or claim a guaranteed saving.
Also identify existing commitments. A new target can be ready before an old contract ends, so an overlap period may belong in the budget even when the technical cutover is short.
Count shared dependencies before pricing reports
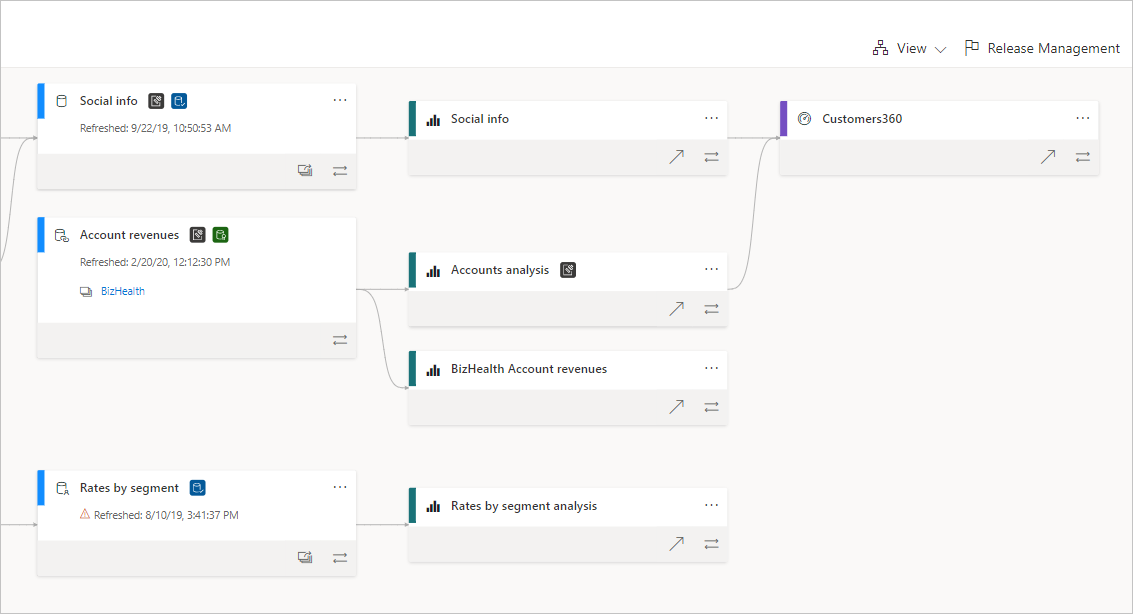
The Power BI lineage screenshot illustrates why one model can support several reports. Estimate the common model once, then estimate each dependent report's remaining work. Conversely, visually similar reports can use different definitions and require separate review.
For Tableau, make the same distinction between dashboards, worksheets, and shared data sources. Identify hidden supporting work such as parameters, actions, and file preparation.
Our example has one order source feeding Regional Sales, Product Mix, and Order Detail. The shared revenue definition is one item; the region-selection behavior, detail navigation, and export are additional items.
Use a small example to expose the expensive questions
This guide uses the Greyfield sample orders CSV: eight synthetic orders across January and February 2026. Each row is one order. Revenue is in generic currency units, with no tax, returns, or currency conversion. Dataset notes and calculated expected results are included. The arithmetic was checked independently with SQLite; it is a test specification, not a claim that a migration has passed in all three products.
The sample's January baseline is 290 across five orders. That simple total is only the beginning. Known Customers must return five across both months rather than summing monthly counts to six. O104 must follow the intended date role. O105 must not be duplicated by the three-line join.
Those cases are small enough to investigate quickly, but they represent different work: calculation semantics, date modeling, and grain. A pilot should reveal which kinds exist in the real source and how much effort their resolution takes.
The fixture cannot estimate production performance, source extraction, or your team's review availability. Those need their own evidence.
Break the estimate into work packages
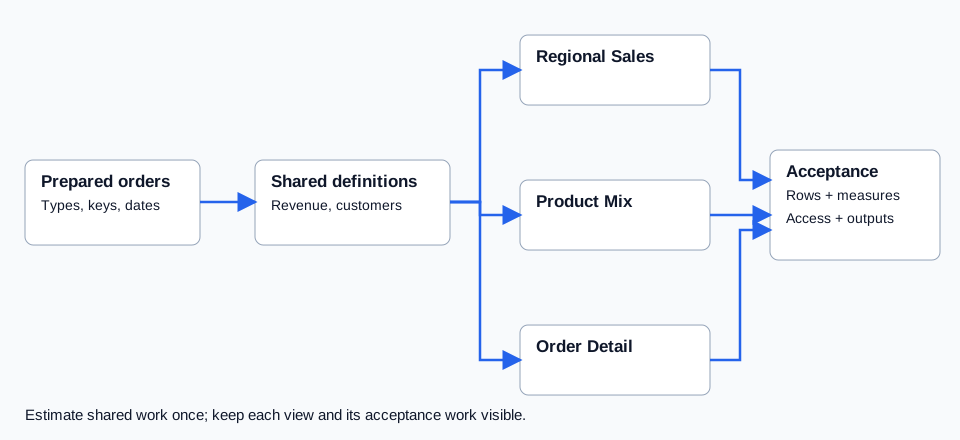
Use separate lines for source inventory, data preparation, shared model work, report layout, interactions, access, exports, validation, and handover.
For each line, record the unit being estimated, the count, the effort range, the dependency, and the assumption. For example, “three views using one approved revenue definition” is more useful than “three dashboards, medium complexity.”
Record whether a task is included, excluded, or waiting on discovery. If the source data must be moved out of an imported model or extract, identify that explicitly. It should not appear late as an unexplained dashboard overrun.
Measure the whole pilot, including review and repair
Track time spent discovering the source, preparing the data, building the target, testing, resolving differences, and incorporating owner feedback. Record waiting time separately.
Automated conversion may reduce a portion of the build effort. It does not establish the total delivery effort unless review, corrections, access, and outputs are also included.
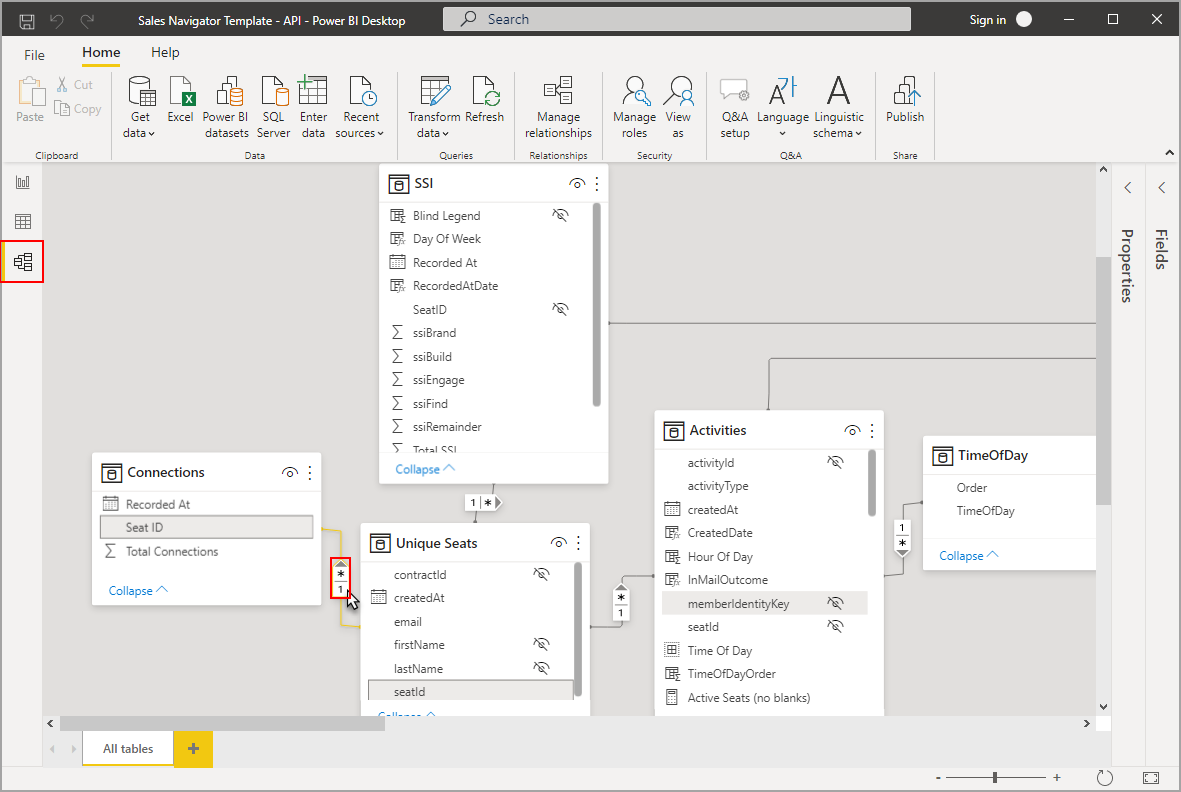
The model screenshot shows the kind of relationship detail that may need investigation. If the pilot reveals ambiguous date relationships or duplicated header values, include the resolution in the estimate rather than pricing only the final chart.
Also record which work becomes reusable. A tested common metric or mapping can help the next report. A report-specific navigation issue may not.
Make an estimate that can be recalculated
Suppose, purely as an arithmetic illustration, the assessed scope contains 30 hours of shared work, three views at 8 hours each, 18 hours of validation, and 8 hours of handover. That is 80 hours before any separately identified uncertainty.
If the agreed blended rate is 150 currency units per hour, the arithmetic is 12,000 units. These are invented inputs to demonstrate the method, not Greyfield pricing, an industry benchmark, or a forecast for your project.
Replace each input with evidence from the assessment and pilot. If one view needs a different interaction design, estimate it separately rather than forcing every view into the same average.
Tie contingency to unresolved decisions
List uncertain items and the work they could add. Examples include missing source access, undocumented preparation, an unresolved metric definition, an untested embedded flow, or a delivery integration.
Give each an owner and a decision date. Where possible, estimate the specific extra work or define a discovery step that will narrow it. An unexplained percentage on top of the quote is harder to evaluate than an explicit unresolved dependency.
Separate scope changes from defects in the agreed scope. Adding a new operational workflow is different from correcting a measure that was required to match all along.
Include acceptance and retirement in the commercial scope
Name who reviews the results, how exceptions are approved, and what handover materials are included. Define whether scheduled deliveries, old links, and source retirement are part of the project.
A proposal that ends at “workbook published” can leave the business doing the final migration work itself. Include the expected observation period and ownership of issues discovered during it.
I would start a cost discussion with one representative source and its dependencies. The assessment guide defines the inputs; the pilot guide explains how to turn them into evidence for a Power BI or Tableau scope.
Related
10 checks before approving a Sigma migration cutover
Review acceptance evidence, permissions, delivery, ownership, recovery, and retirement decisions before switching users from Tableau or Power BI to Sigma.
Calculation acceptance7 DAX measure tests to define before migrating Power BI to Sigma
Define expected behavior for Power BI measures before rebuilding them in Sigma, including totals, filters, distinct counts, dates, blanks, ratios, and relationships.
Tableau workflow review7 Tableau interactions to review before moving to Sigma
Document how people use Tableau before rebuilding their workflows in Sigma, from filter scope and parameters to actions, tooltips, navigation, and exports.