What can you do with business numbers you trust?
Trusted numbers let you make a specific call on spend, products, retention, or inventory, with an owner and a way to check the result. They don't prove cause.

Greyfield Data
In this article 7 sections
You can make a specific call and defend it. Trusted numbers let you decide where to test the next dollar, which product to back, which customers to contact, and what to reorder, without spending the meeting arguing about whose report is right.
They don't tell you what caused a result, and they don't predict next month. A trusted number is an accurate description of what happened. Decisions still need judgment and a way to check the result.
Here's how to use one.
Start with the decision
Don't start with a dashboard. Write down the decision first.
| Decision | Question | Metric that can change the call |
|---|---|---|
| Next test | Where should the next $5,000 go? | Contribution per order, plus a test result |
| Product | Which product deserves more support? | Contribution after returns, by product |
| Retention | Which customers get a message now? | Days since last order, by product bought |
| Inventory | What do we review for reorder? | Units sold per day against units on hand |
If no result would change what you do, you don't need the report. A number you'd ignore either way is only decoration.
Follow one decision through
Here's a made-up store with two bundles. It has $5,000 to put behind one of them next month. Both are measured over the same 60 days, and both have finished their return window. Customers paid no shipping. Net sales are already after refunds, so return cost here only covers return shipping and handling.
| Per order | Bundle A | Bundle B |
|---|---|---|
| Net sales | $60.00 | $48.00 |
| Cost of goods | $30.00 | $22.00 |
| Fulfillment | $12.00 | $9.00 |
| Payment fees | $1.80 | $1.44 |
| Return cost | $8.00 | $2.00 |
| Contribution | $8.20 | $13.56 |
Bundle A looks better in a sales report. It brings in $12 more per order. After costs, Bundle B leaves $5.36 more.
That's a good reason to test Bundle B. It isn't proof that more spend will work, because this table describes past buyers. People reached by new ads may act differently.
Check the number before you use it
Trust isn't a feeling. It's a set of checks you've run on this number:
- It ties to a source report, or the gap is explained.
- The definition is written down, and the people using it agree.
- Both bundles are compared over the same period and age.
- Refunds and returns have had time to arrive.
- Costs are real for this period, not a blended guess.
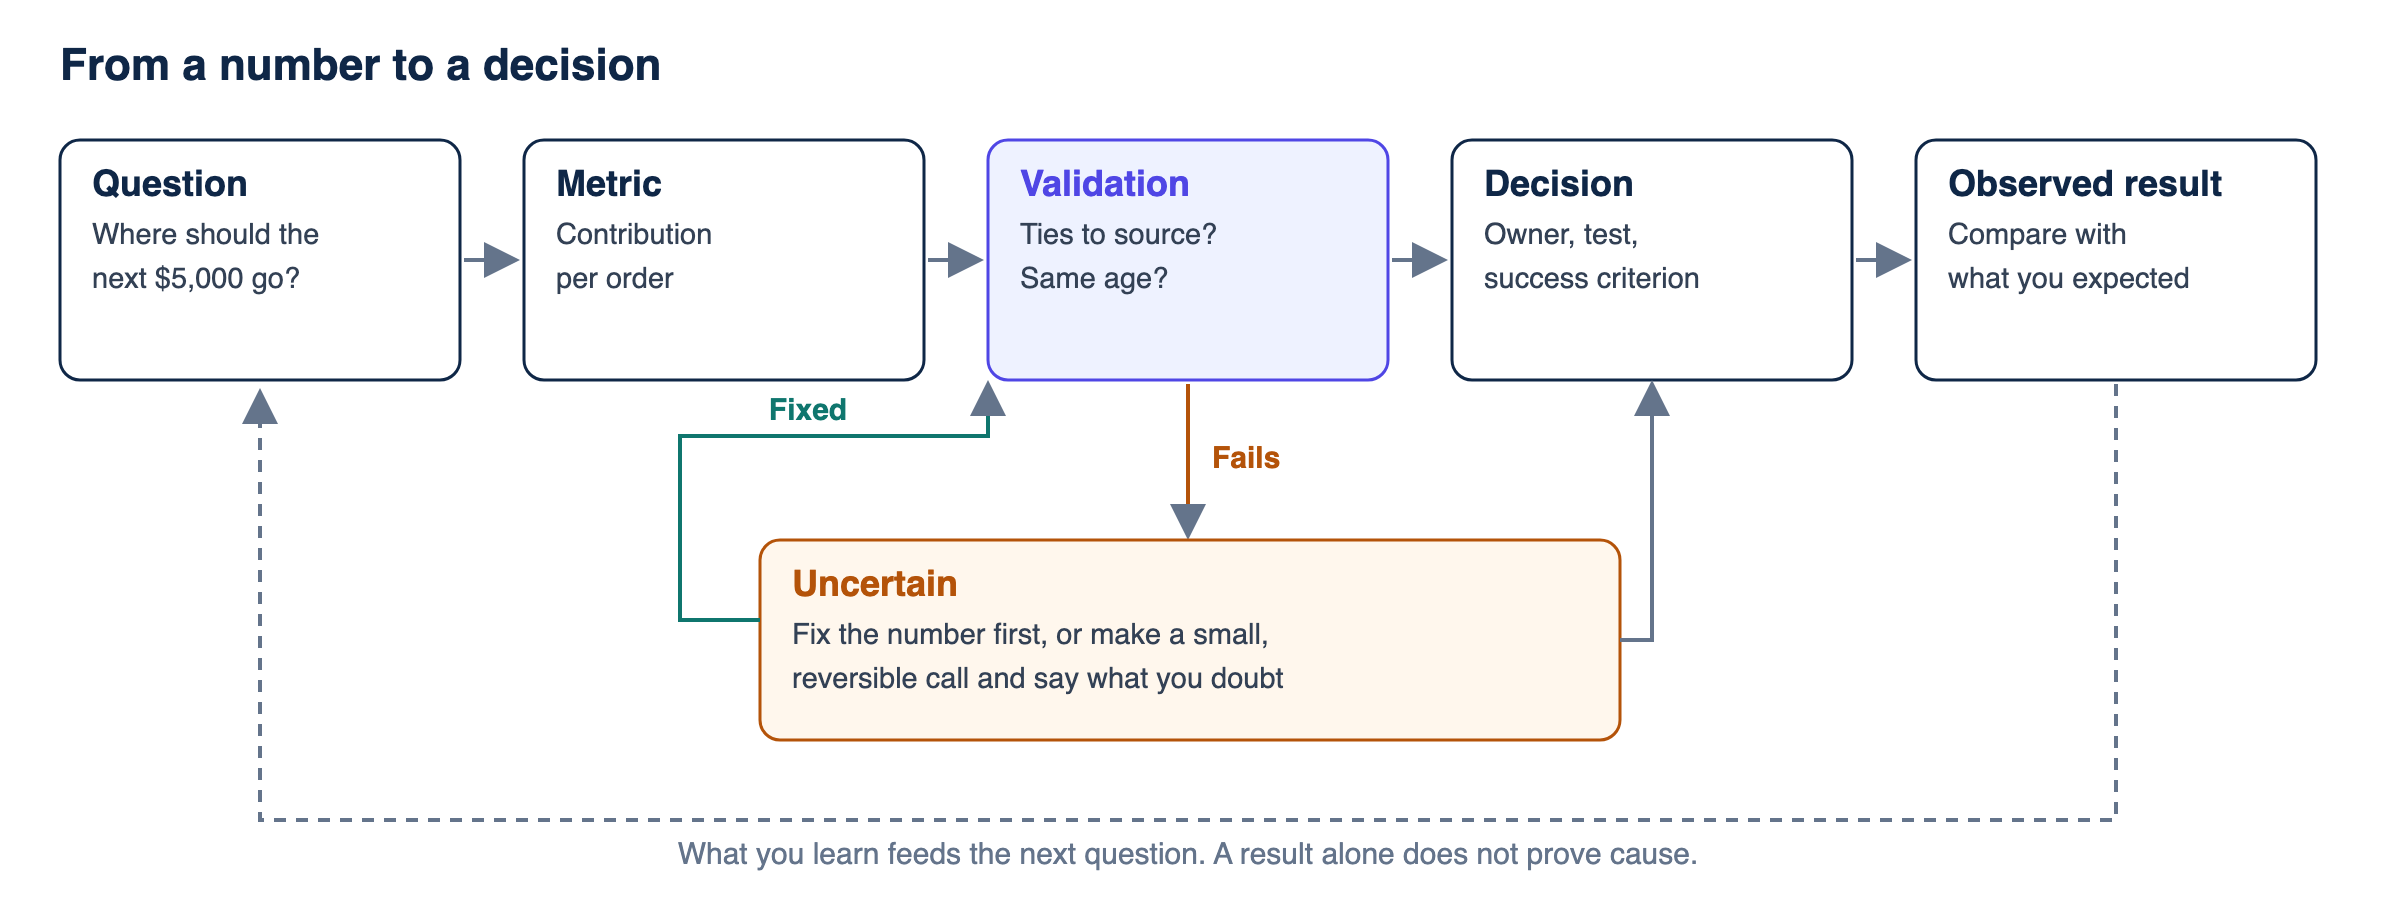
If a check fails, you have two honest options. Fix the number first, or make the call anyway and say what you're unsure of. In this example, if return costs were an estimate, you'd say so, because the whole gap depends on them. If Bundle B's return cost were $5.36 higher, its lead would be gone.
That's the uncertainty branch in the diagram. Some decisions can't wait for perfect data, and a small, reversible test is often fine with less certainty than a big inventory order.
Turn it into a decision record
A short note does the job:
| Field | Bundle example |
|---|---|
| Decision | Put the $5,000 test behind Bundle B |
| Why | $13.56 against $8.20 contribution per order |
| Owner | Growth lead |
| Method | Holdout, with a control group that doesn't see the test |
| Success criterion | Treatment minus control contribution covers the $5,000 test spend by the review date |
| Review date | When the test orders pass their return window |
| Assumption | Return cost is measured, not estimated |
The success criterion matters most. Write it before you see the result, so you aren't making up a reason afterward.
Tie it to the test, not just to contribution per order. A bundle can hold $13.56 an order and still lose money if the orders cost too much to win. At $13.56, the test needs about 369 incremental orders to cover $5,000, before any repeat purchases.
Then measure what happened
Run the test, then compare what you expected with what you saw. This is the feedback loop, and most teams skip it.
Be careful with what the result means. If Bundle B's sales go up after you spend more, that doesn't show the spend caused it. A season, a promotion, or a competitor could be behind it. If you need to know what the spend caused, use a holdout or a lift test. Google's Conversion Lift compares a group that saw ads with a group that didn't, though it isn't available for every account. Without a holdout, call the result observed, because it can't show causal payback.
What this looks like in other decisions
Stopping spend. Trusted numbers show which channels look weak after costs. Before you cut one, check what kind of CAC you're looking at. A channel can look poor on attribution and still drive sales.
Backing a product. Look at contribution after returns, not sales. A high-revenue product with heavy returns can be worth less than it looks. Use a cohort at the same age, since recent orders haven't had time to come back.
Retention. A date-based list tells you who hasn't reordered. Test whether contacting them changes anything, because some of them were coming back anyway.
Inventory. A sales rate is only a starting point. Check whether a slow week was weak demand or an item being out of stock.
Start with the morning number
If this feels far off, start small. Pick the one number your team argues about most, and tie it out. Then put it on a daily scorecard with a written definition, and use a semantic layer if several tools need the same answer.
The first useful outcome is often small: a meeting that moves on to the decision, because nobody's questioning the number.
If you've got a better way to write these down, I'd like to see it.
This scenario is made up, and your costs will differ. If you've got a decision that keeps stalling on conflicting numbers, the ecommerce data warehouse page shows how I'd approach it.
Related
How to avoid double-counting Shopify, Amazon and TikTok orders
Separate the sales channel from the fulfillment provider, link mirrored orders, and reconcile revenue before combining Shopify, Amazon and TikTok Shop reports.
GuideMap SKUs across Shopify, Amazon and TikTok without breaking margin
Build a product crosswalk with source IDs, dated mappings and explicit bundle quantities. Catch duplicate joins and missing costs before calculating product margin.
GuideShopify refund date vs order date: why monthly sales differ
A refund processed this month can belong to last month's order. Learn how event-date and order-cohort reporting differ and reconcile both without double counting.