How do you choose a data platform beyond the feature list?
Compare data platforms on support, customer experience, cost controls, and ecosystem, not only features. What to check, how to test each one, and a checklist.

Written by Linus Tse, founder of Greyfield Data
· 8 min read
On this page 10 sections
One of Snowflake's best features doesn't show up in a product demo. It's what happens after you open a support ticket.
People spend a lot of time comparing data platforms on performance, architecture, and new features. The experience of being a customer matters too, and this post covers how to evaluate it: support, customer experience, cost controls, and ecosystem, with a checklist you can use in a trial. If you'd like help running that evaluation or setting up the platform you pick, that's part of our Snowflake consulting work.
Key takeaways
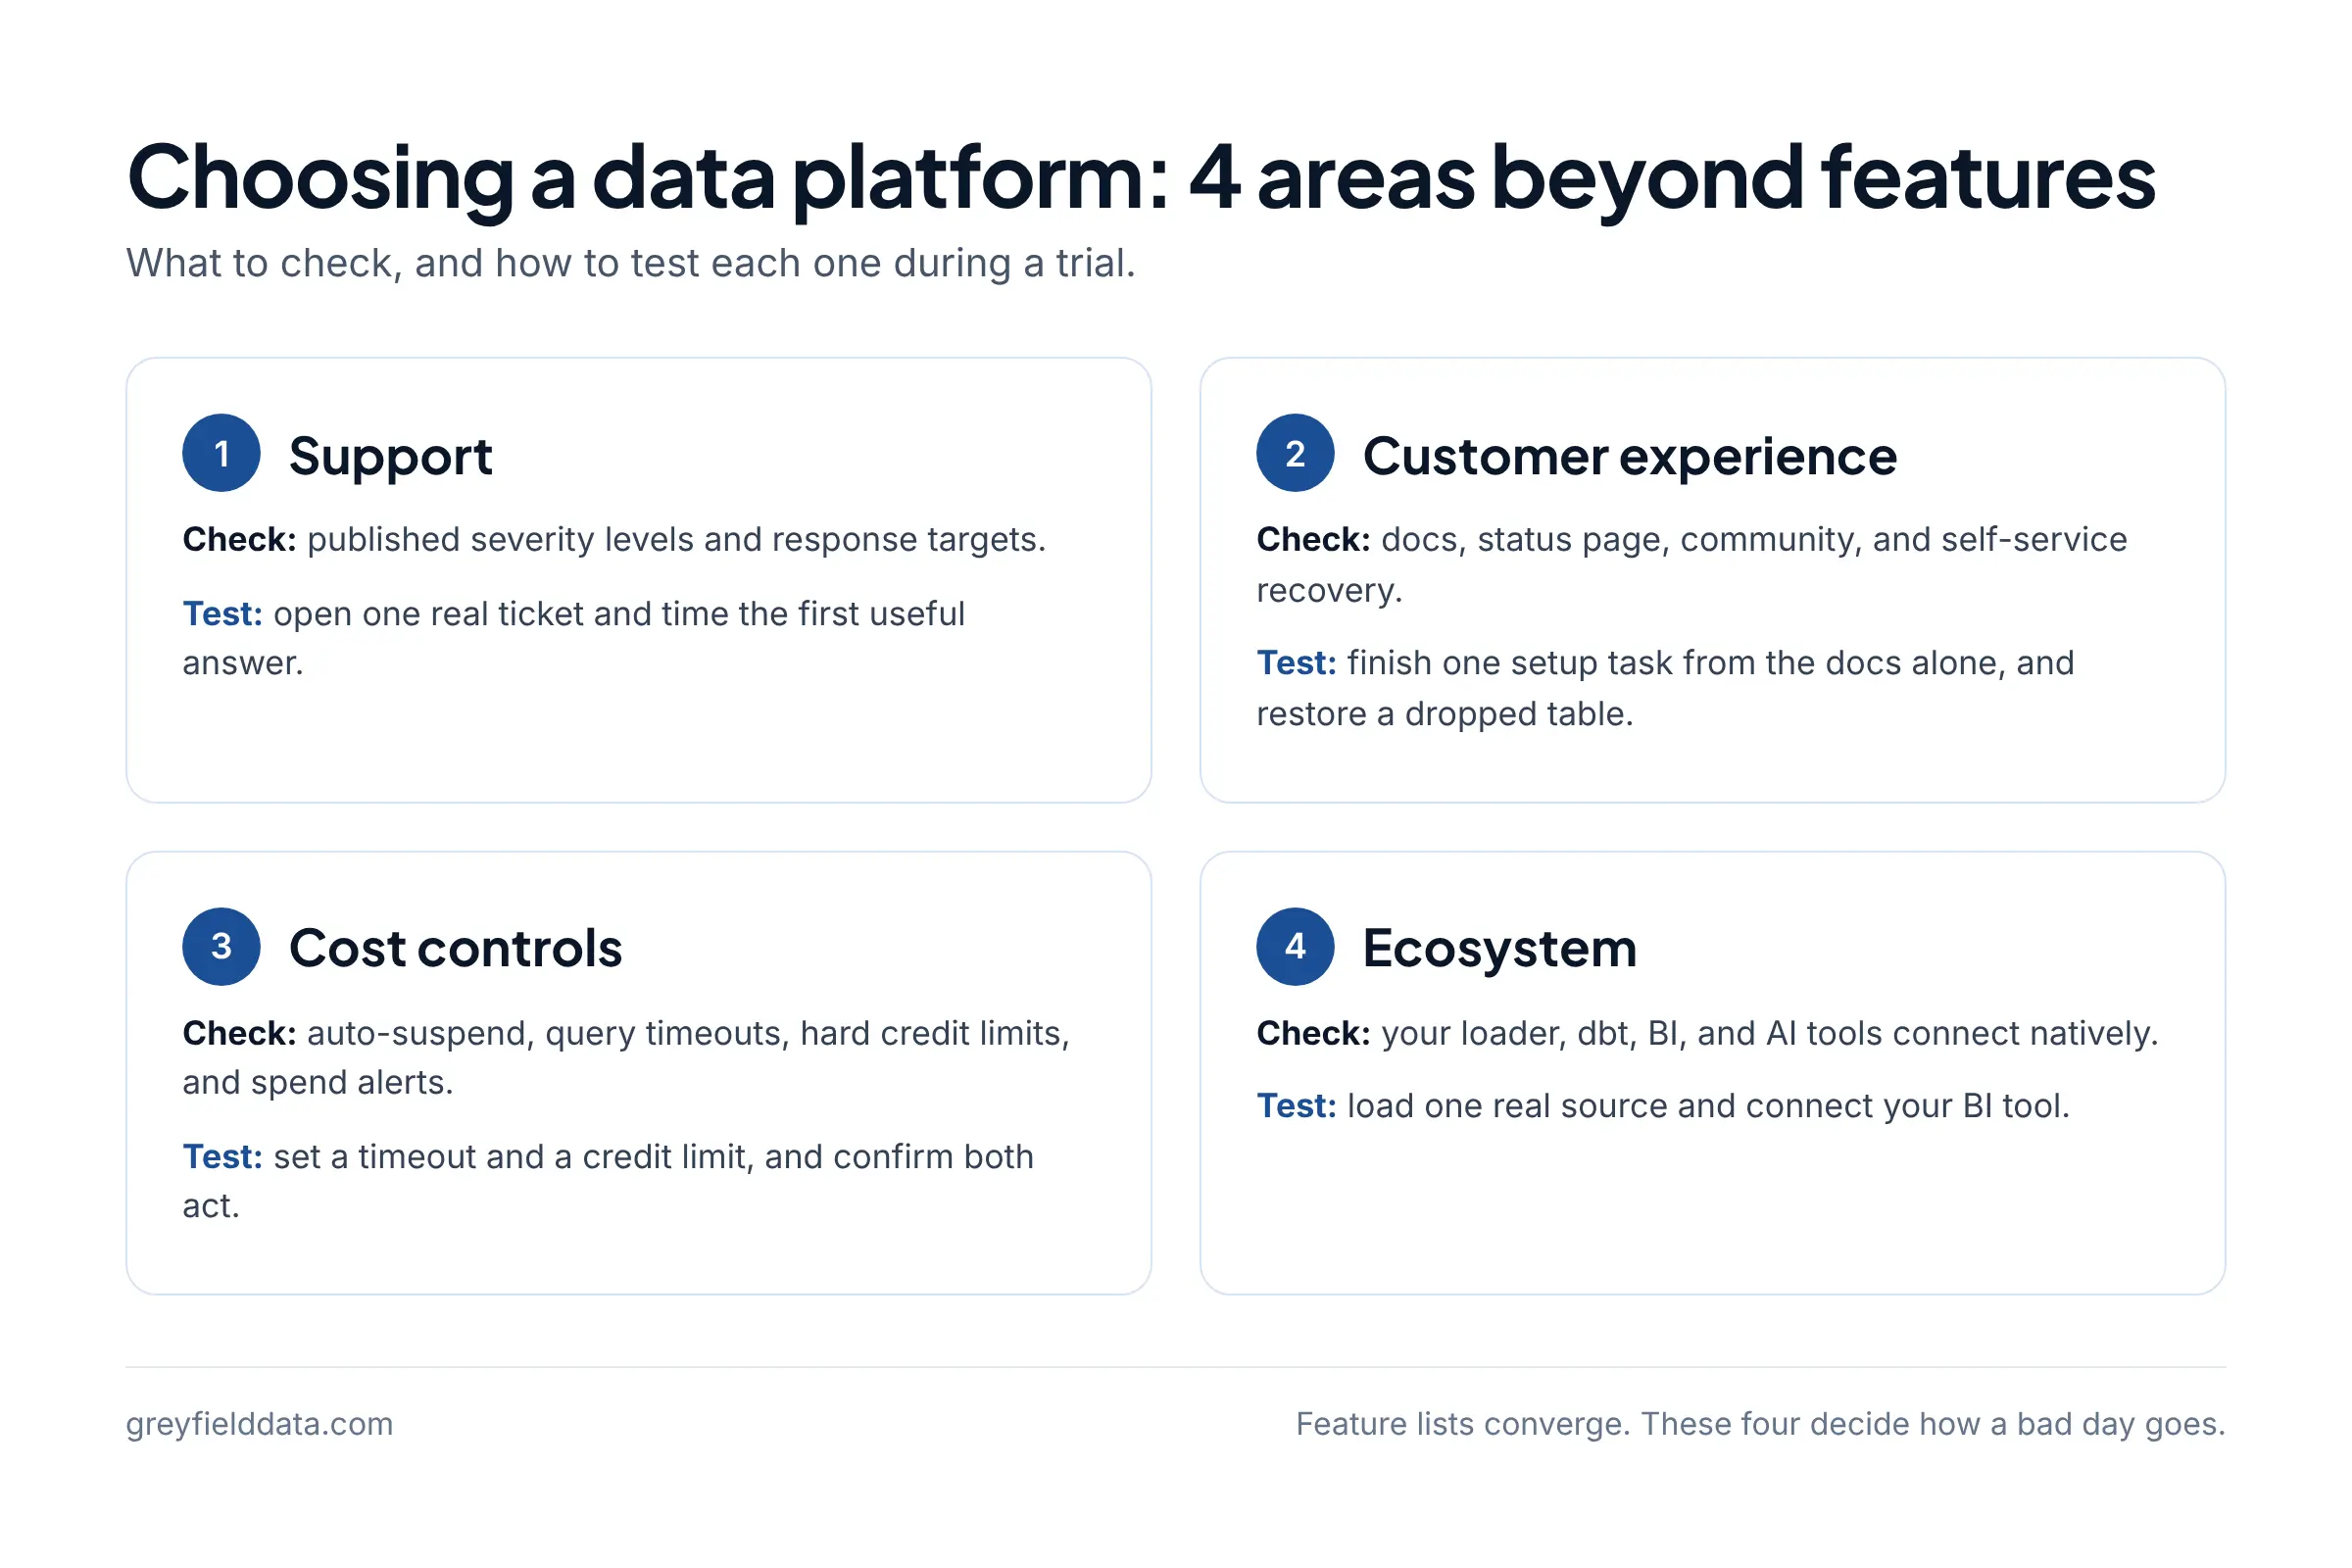
- Feature lists converge. The differences you live with for years are how support responds, how predictable the bill is, and what plugs into the platform.
- Read the vendor's published support policy. Snowflake's lists initial response targets by severity, such as one hour for a Severity 1 case on its standard support offering.
- Test support during the trial: open a real ticket and note how long it takes to reach someone who is actually working the problem.
- Cost controls should be things you can set on day one: auto-suspend, query timeouts, spend limits that act, and alerts that warn.
- Check the ecosystem against your own list of tools: your loaders, your transformation tool, and your BI tool.
Why look beyond the feature list?
Because most serious platforms can store your data and run your queries. What separates them shows up later, when something breaks, when the bill moves, or when you add a tool.
When an important system has a problem, you need to know that someone will show up and help you fix it. That doesn't appear on a comparison grid, but it decides how a bad day goes.
What happened when I opened a Snowflake support ticket?
I recently filed a support ticket with Snowflake. Within a couple of hours, I had a response from someone who was actually helping me solve the problem. They went into the logs and dug into the incident.
And this wasn't a one-off. I've seen the same thing happen over and over. Snowflake is a massive company, and staying this customer-facing at that size is hard.
That sounds like a small thing. If you've dealt with enterprise software support, you know it isn't. Snowflake has done that for me again and again.
How do you evaluate a platform's support?
Start with the published policy, then test it yourself. The policy tells you what the vendor commits to. The test tells you what it feels like.
Read the support policy
Look for severity definitions, initial response targets, support hours, and how you open a case. Snowflake publishes all four in its support policy. These are its initial response targets when I checked:
| Severity | Snowflake Support | Priority Support |
|---|---|---|
| 1, Critical: the service is unusable | 1 hour | 15 minutes |
| 2, High: key parts seriously impaired | 2 business hours | 2 hours |
| 3, Medium: some functionality still works | 1 business day | 4 business hours |
| 4, Low: little or no impact | 2 business days | 1 business day |
Two details from the same policy are worth knowing before you need them. A case with no severity set defaults to Severity 4, and you can open cases from the web interface or the Snowflake Community. Snowflake's editions page also lists 24/7 coverage for Severity 1 issues.
Test it during the trial
Open one real ticket while you evaluate. Pick a genuine question, such as how to read a query profile or why a load failed, and record:
- How long until the first response.
- Whether the first response works the problem, or asks you to restate it.
- Whether they looked at your account, logs, or query IDs.
- How the case was closed, and whether you'd be comfortable on a bad day.
What does a good customer experience look like?
It's everything around the product that saves you time: documentation, status reporting, a community where questions get answered, and an account team that knows your setup.
| Area | What to check | Snowflake example |
|---|---|---|
| Documentation | Are the docs specific enough to follow without a call? | Snowflake documentation |
| Status | Is there a public status page for incidents by region? | status.snowflake.com |
| Community | Do questions get real answers, and can you open cases there? | Snowflake Community |
| Recovery | Can you undo a mistake without a ticket? | Time Travel and zero-copy cloning |
Recovery is the one people forget. Being able to restore a dropped table yourself is customer experience too.
Which cost controls should a data platform have?
It should have controls that stop spend, controls that warn you before spend gets out of hand, and a way to see where the credits went. If you have to build any of these yourself, count that as part of the platform's cost.
| Control | What it does | Snowflake feature |
|---|---|---|
| Idle shutdown | Stops paying for compute nobody is using | Auto-suspend and auto-resume, with per-second billing and a 60-second minimum each time a warehouse starts |
| Query timeout | Cancels a runaway query | STATEMENT_TIMEOUT_IN_SECONDS, which defaults to 172800 seconds (2 days) |
| Hard limit | Suspends warehouses when a credit quota is used | Resource monitors |
| Spend alert | Warns when spend is projected to pass a monthly limit, including some serverless features | Budgets |
| Visibility | Shows which warehouse and which queries used credits | Exploring cost and QUERY_HISTORY |
The default timeout is the one to change first. Two days is a long time for a bad query to run, especially once AI agents are writing queries. In a trial, set a timeout on each warehouse and a resource monitor on the account, then check that both behave the way you expect:
-- Cancel any statement on this warehouse after 10 minutes
ALTER WAREHOUSE reporting_wh SET STATEMENT_TIMEOUT_IN_SECONDS = 600;

-- Warn at 80% of a monthly credit quota, suspend at 100%
CREATE RESOURCE MONITOR monthly_limit WITH CREDIT_QUOTA = 100
  TRIGGERS ON 80 PERCENT DO NOTIFY
           ON 100 PERCENT DO SUSPEND;
ALTER WAREHOUSE reporting_wh SET RESOURCE_MONITOR = monthly_limit;
The numbers are placeholders: pick a timeout and a quota that fit your workload. Resource monitors cover warehouses, not serverless features, which is why Snowflake points you to budgets for those. My Snowflake setup script puts these in place before the first load, and this cost spike walkthrough shows how to trace credits back to a workload.
How do you check a platform's ecosystem?
Write down every tool you use or plan to use, then confirm each one connects natively and is maintained. A long partner logo page means little if your loader or BI tool isn't on it.
- Loaders: does your connector (Fivetran, Airbyte, or custom code) support the platform as a destination? See how the common loaders compare.
- Transformation: does dbt run against it, and do your team's habits carry over?
- BI: does your BI tool query it directly, and with which authentication? Sigma's Snowflake connection supports key-pair and OAuth, for example.
- Data sharing and apps: can you get third-party data without building a pipeline? Snowflake has a Marketplace for data and apps, and a partner directory you can search for your tools.
- AI tools: can your team point an AI client at it safely? See connecting Claude to Snowflake.
For a fuller view of where each tool sits, see the modern data stack, mapped.
Data platform evaluation checklist
Copy this into your evaluation doc and tick it off during the trial. Every item is something you can check yourself in a week or two.
Support
- Read the published support policy: severity levels, response targets, hours, and how to open a case
- Confirmed which support level your contract includes
- Opened one real ticket and recorded the time to first useful response
- Checked whether support looked at your account, logs, or query IDs
Customer experience
- Followed one setup task end to end using only the docs
- Found the public status page and checked recent incident history for your region
- Asked one question in the community and saw how it was answered
- Restored a dropped test table without help
Cost controls
- Set auto-suspend on every warehouse
- Set a query timeout on each warehouse
- Created a credit limit that suspends compute, and a spend alert that warns
- Found which warehouse and which queries used the most credits in the trial
Ecosystem
- Listed every loader, transformation, BI, and AI tool you use
- Connected your main loader and loaded one real source
- Connected your BI tool with the authentication you'll use in production
- Ran one dbt model against the platform
Frequently asked questions
What should you look for when choosing a data warehouse?
Performance and features first, then the things you live with: support response, cost controls you can set on day one, and whether your loaders, dbt, and BI tool connect natively. Test each during the trial rather than relying on a sales deck.
How fast does Snowflake support respond?
Snowflake's support policy lists an initial response target of one hour for Severity 1 cases on Snowflake Support and 15 minutes on Priority Support. In my experience, I've had a response from someone working the problem within a couple of hours, more than once.
How do I stop a Snowflake bill from surprising me?
Set auto-suspend on every warehouse, lower the statement timeout from its two-day default, and add a resource monitor that suspends at your credit quota. Add a budget for serverless features, which resource monitors don't cover.
Should support quality really change which platform I pick?
It should carry weight when the platform runs reporting people rely on every day. A quick, competent answer on a bad day is worth more than a feature you might use once.
What to do next
Run the checklist above in your trial, and open that support ticket in the first week. If you're setting up Snowflake, start with what I put in a new Snowflake account. If you'd like a second pair of eyes on the evaluation or the setup, see Snowflake consulting or book a call with me.
Part of the Snowflake guides, a reading path through related articles.
Linus Tse
Founder of Greyfield Data. Built 400+ dashboards. Certified in Sigma, Snowflake, Tableau, and Power BI.
About Linus