The Greyfield Infusion Report 2026
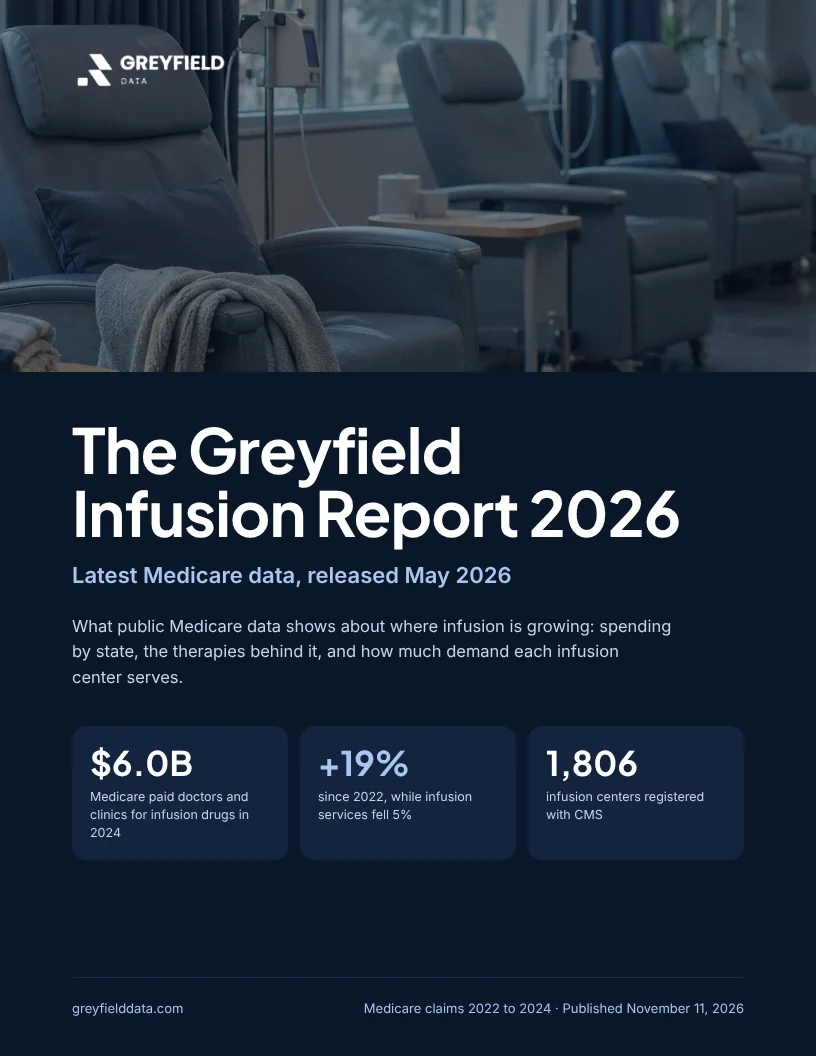
What public Medicare data shows about where infusion is growing: what Medicare pays doctors and clinics for infusion drugs in every state, the therapies behind it, and how much demand each registered infusion center serves. Written for infusion owners and operators deciding where to grow. It uses the 2024 Medicare claims CMS released in May 2026, the most recent available.
Get the white paper
PDF, 10 pages, 203 KB
What's inside
Spending up, infusions down
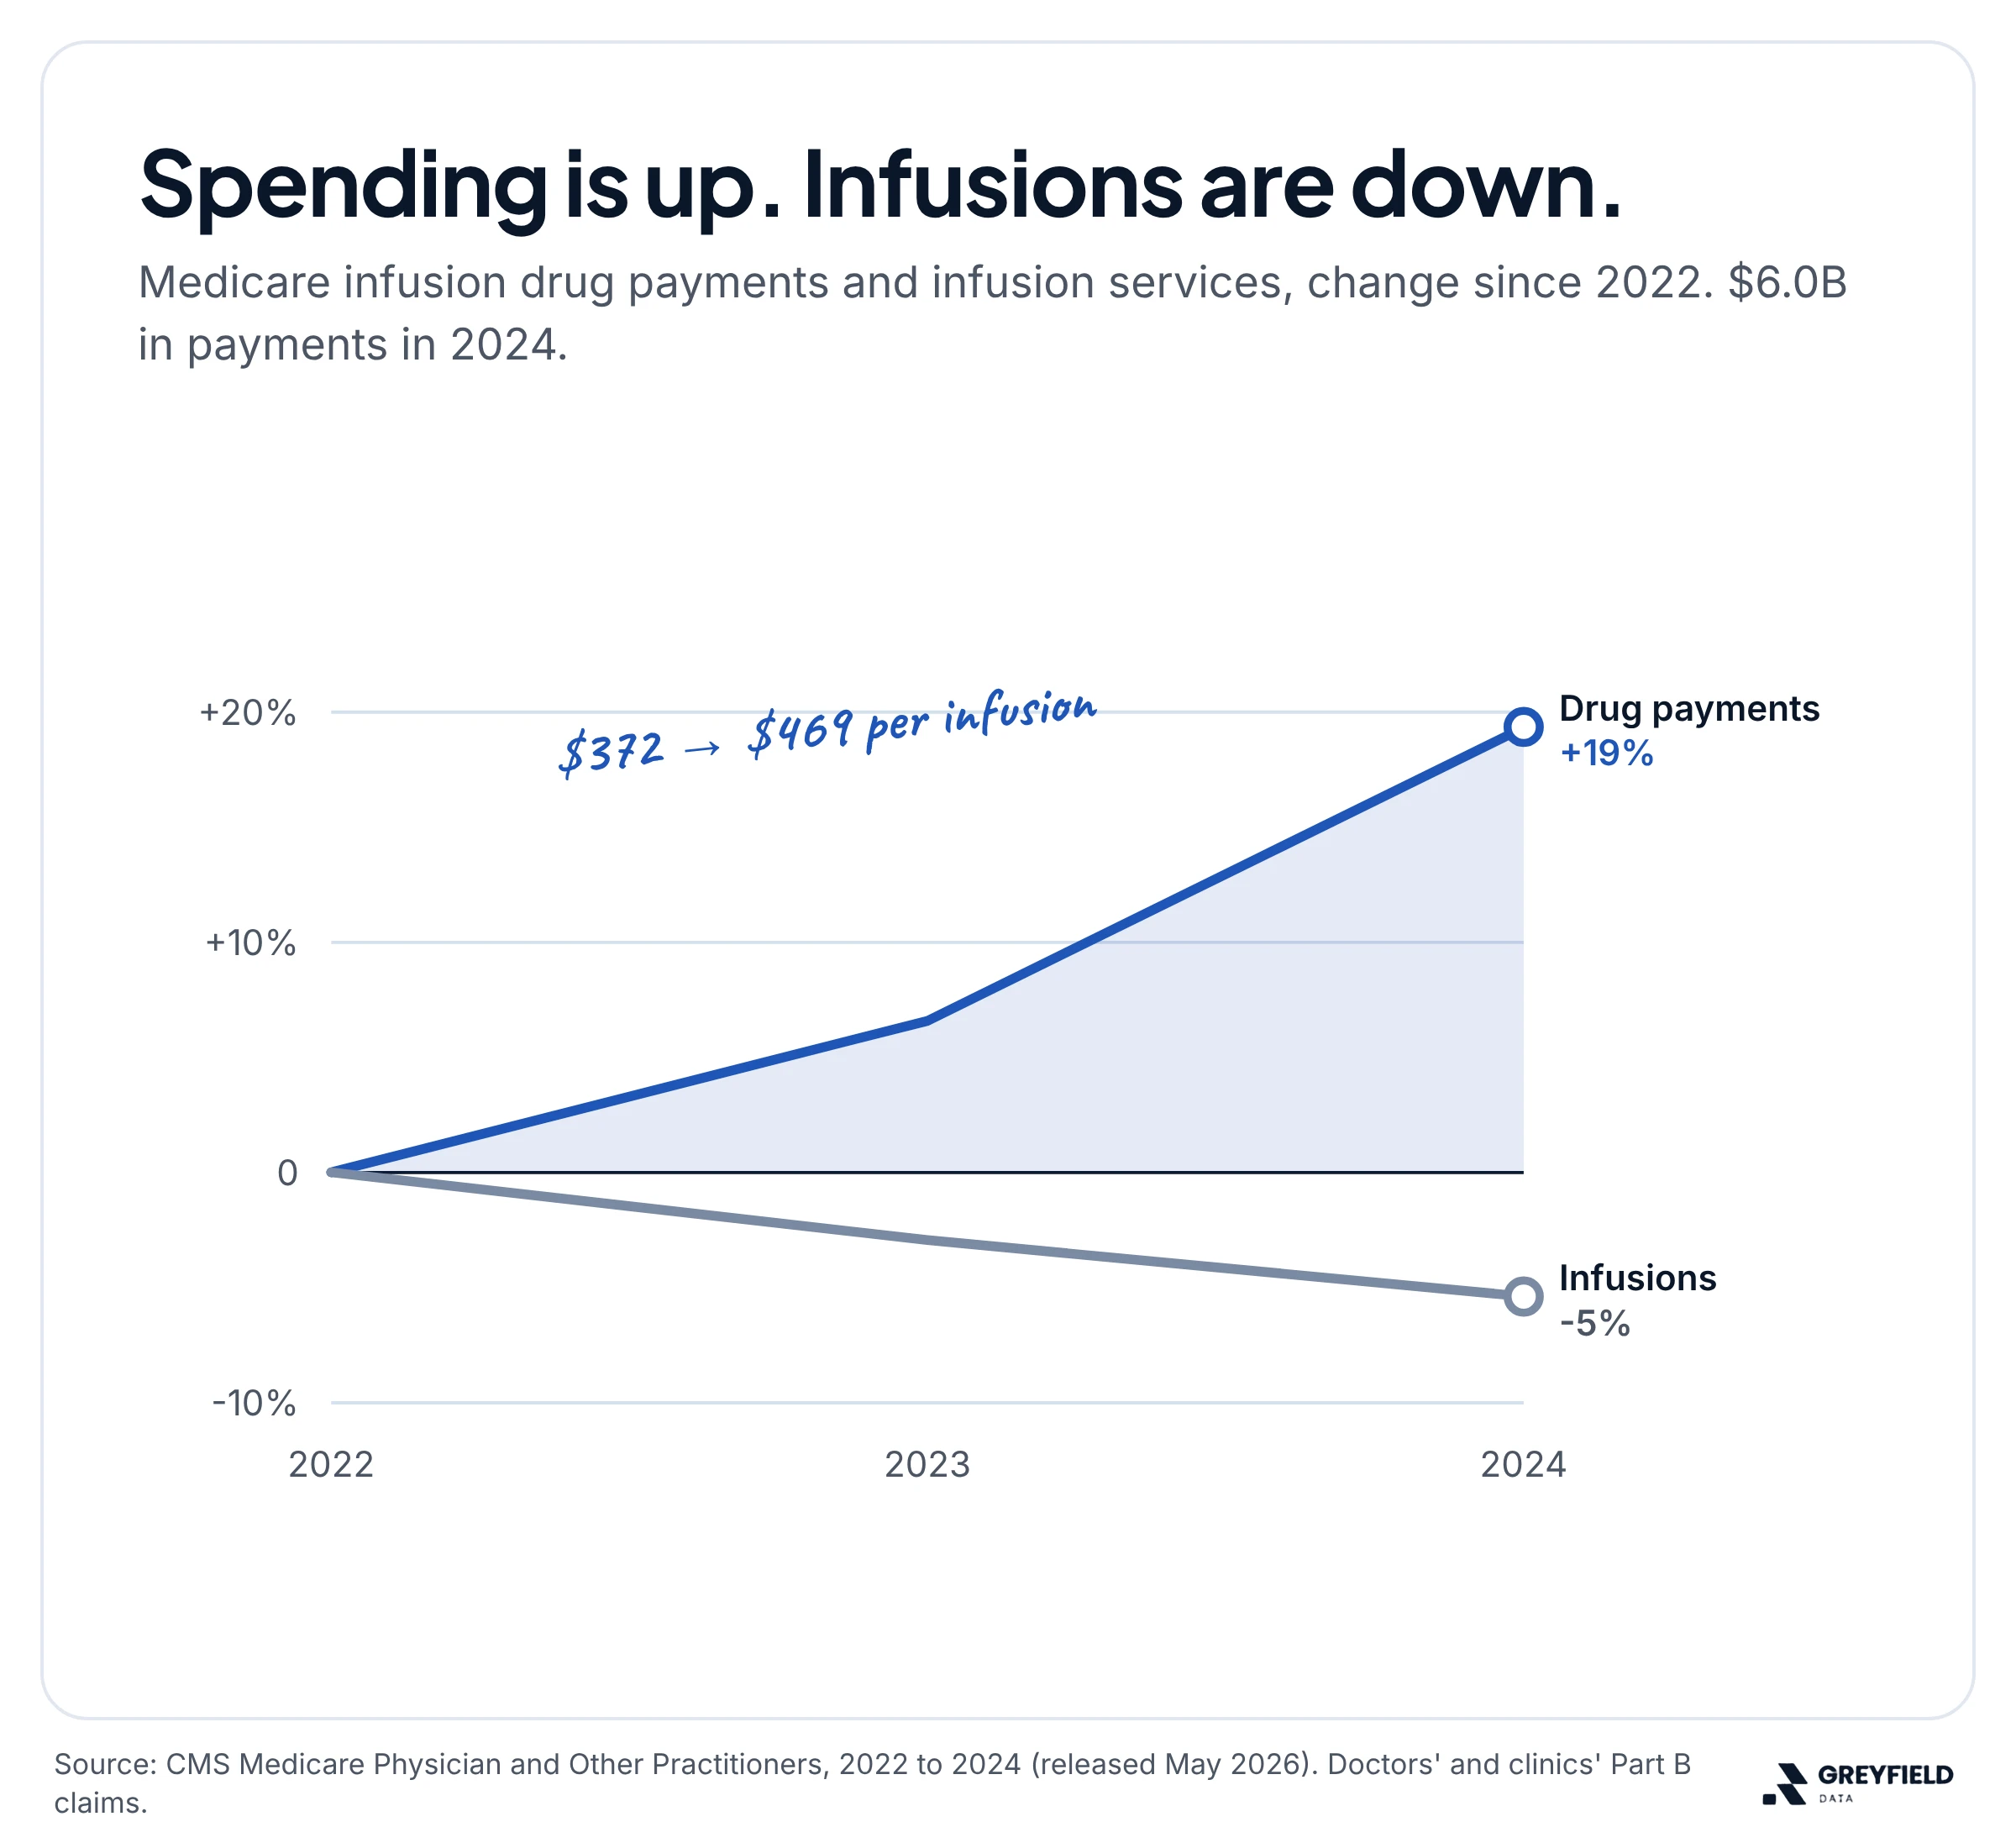
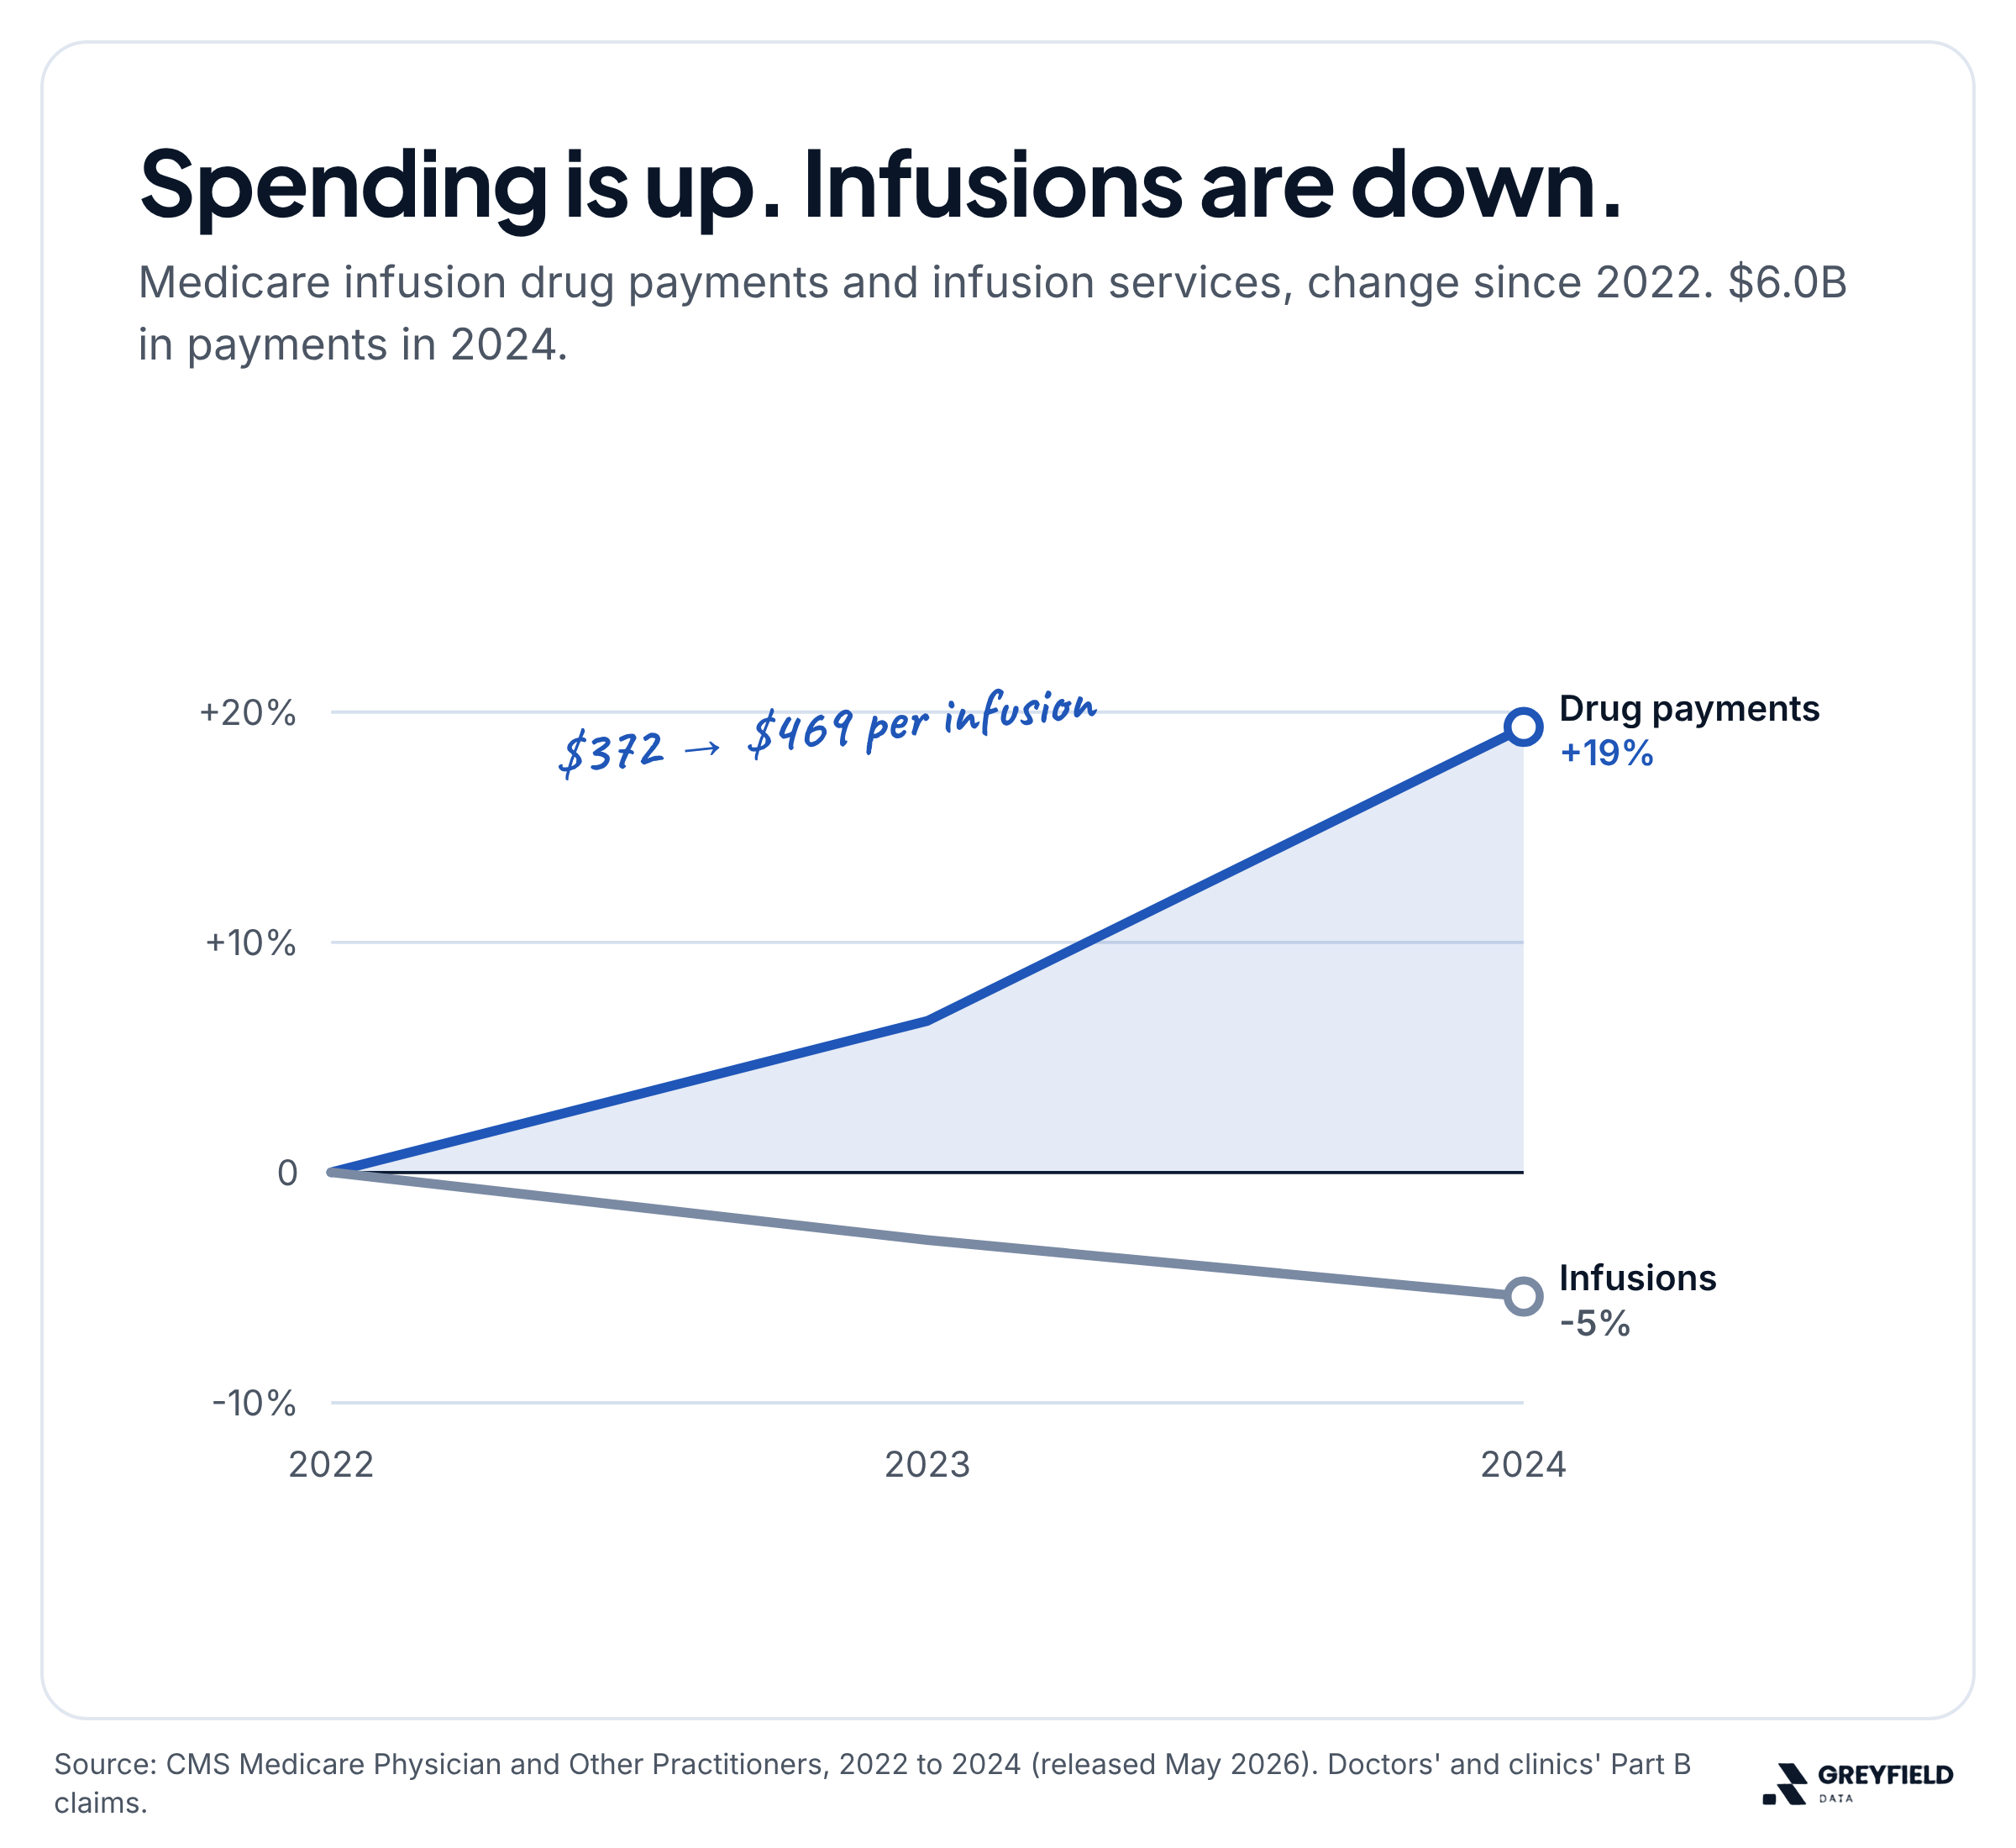
Medicare infusion drug payments grew 19% from 2022 to 2024 while infusion services fell 5%, so each infusion now carries more drug spending.
Where demand is growing, and the biggest markets
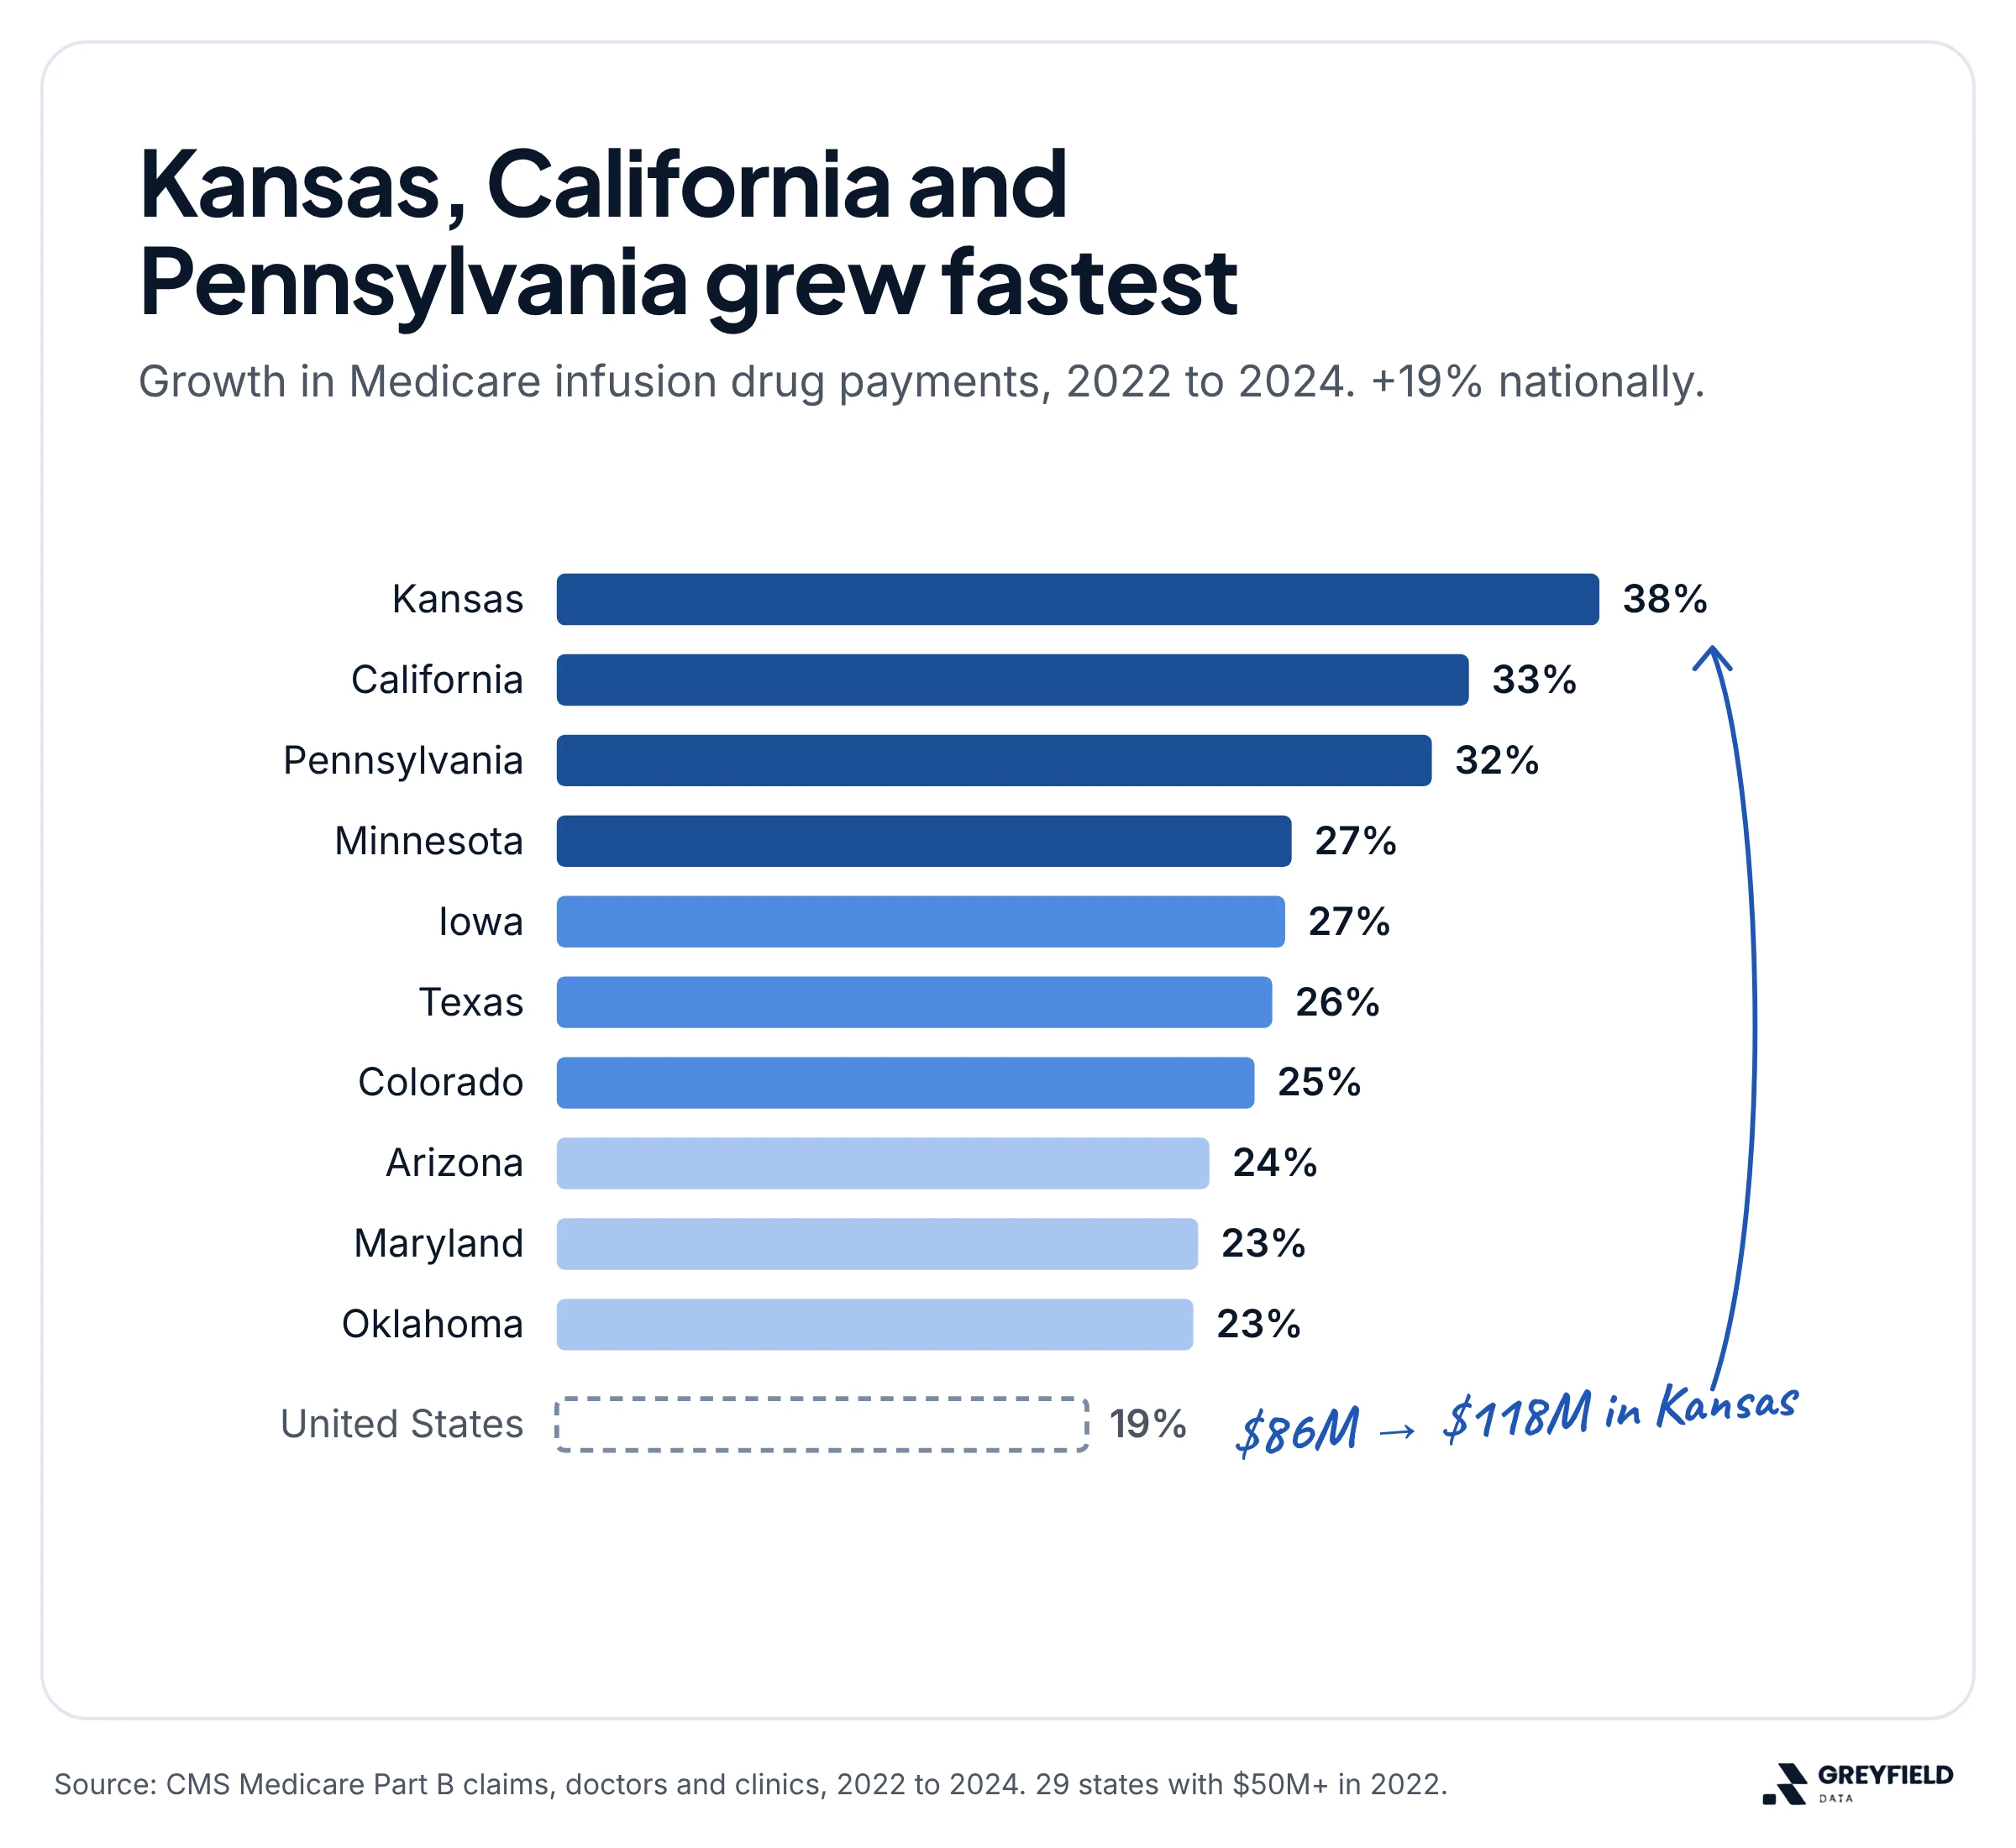
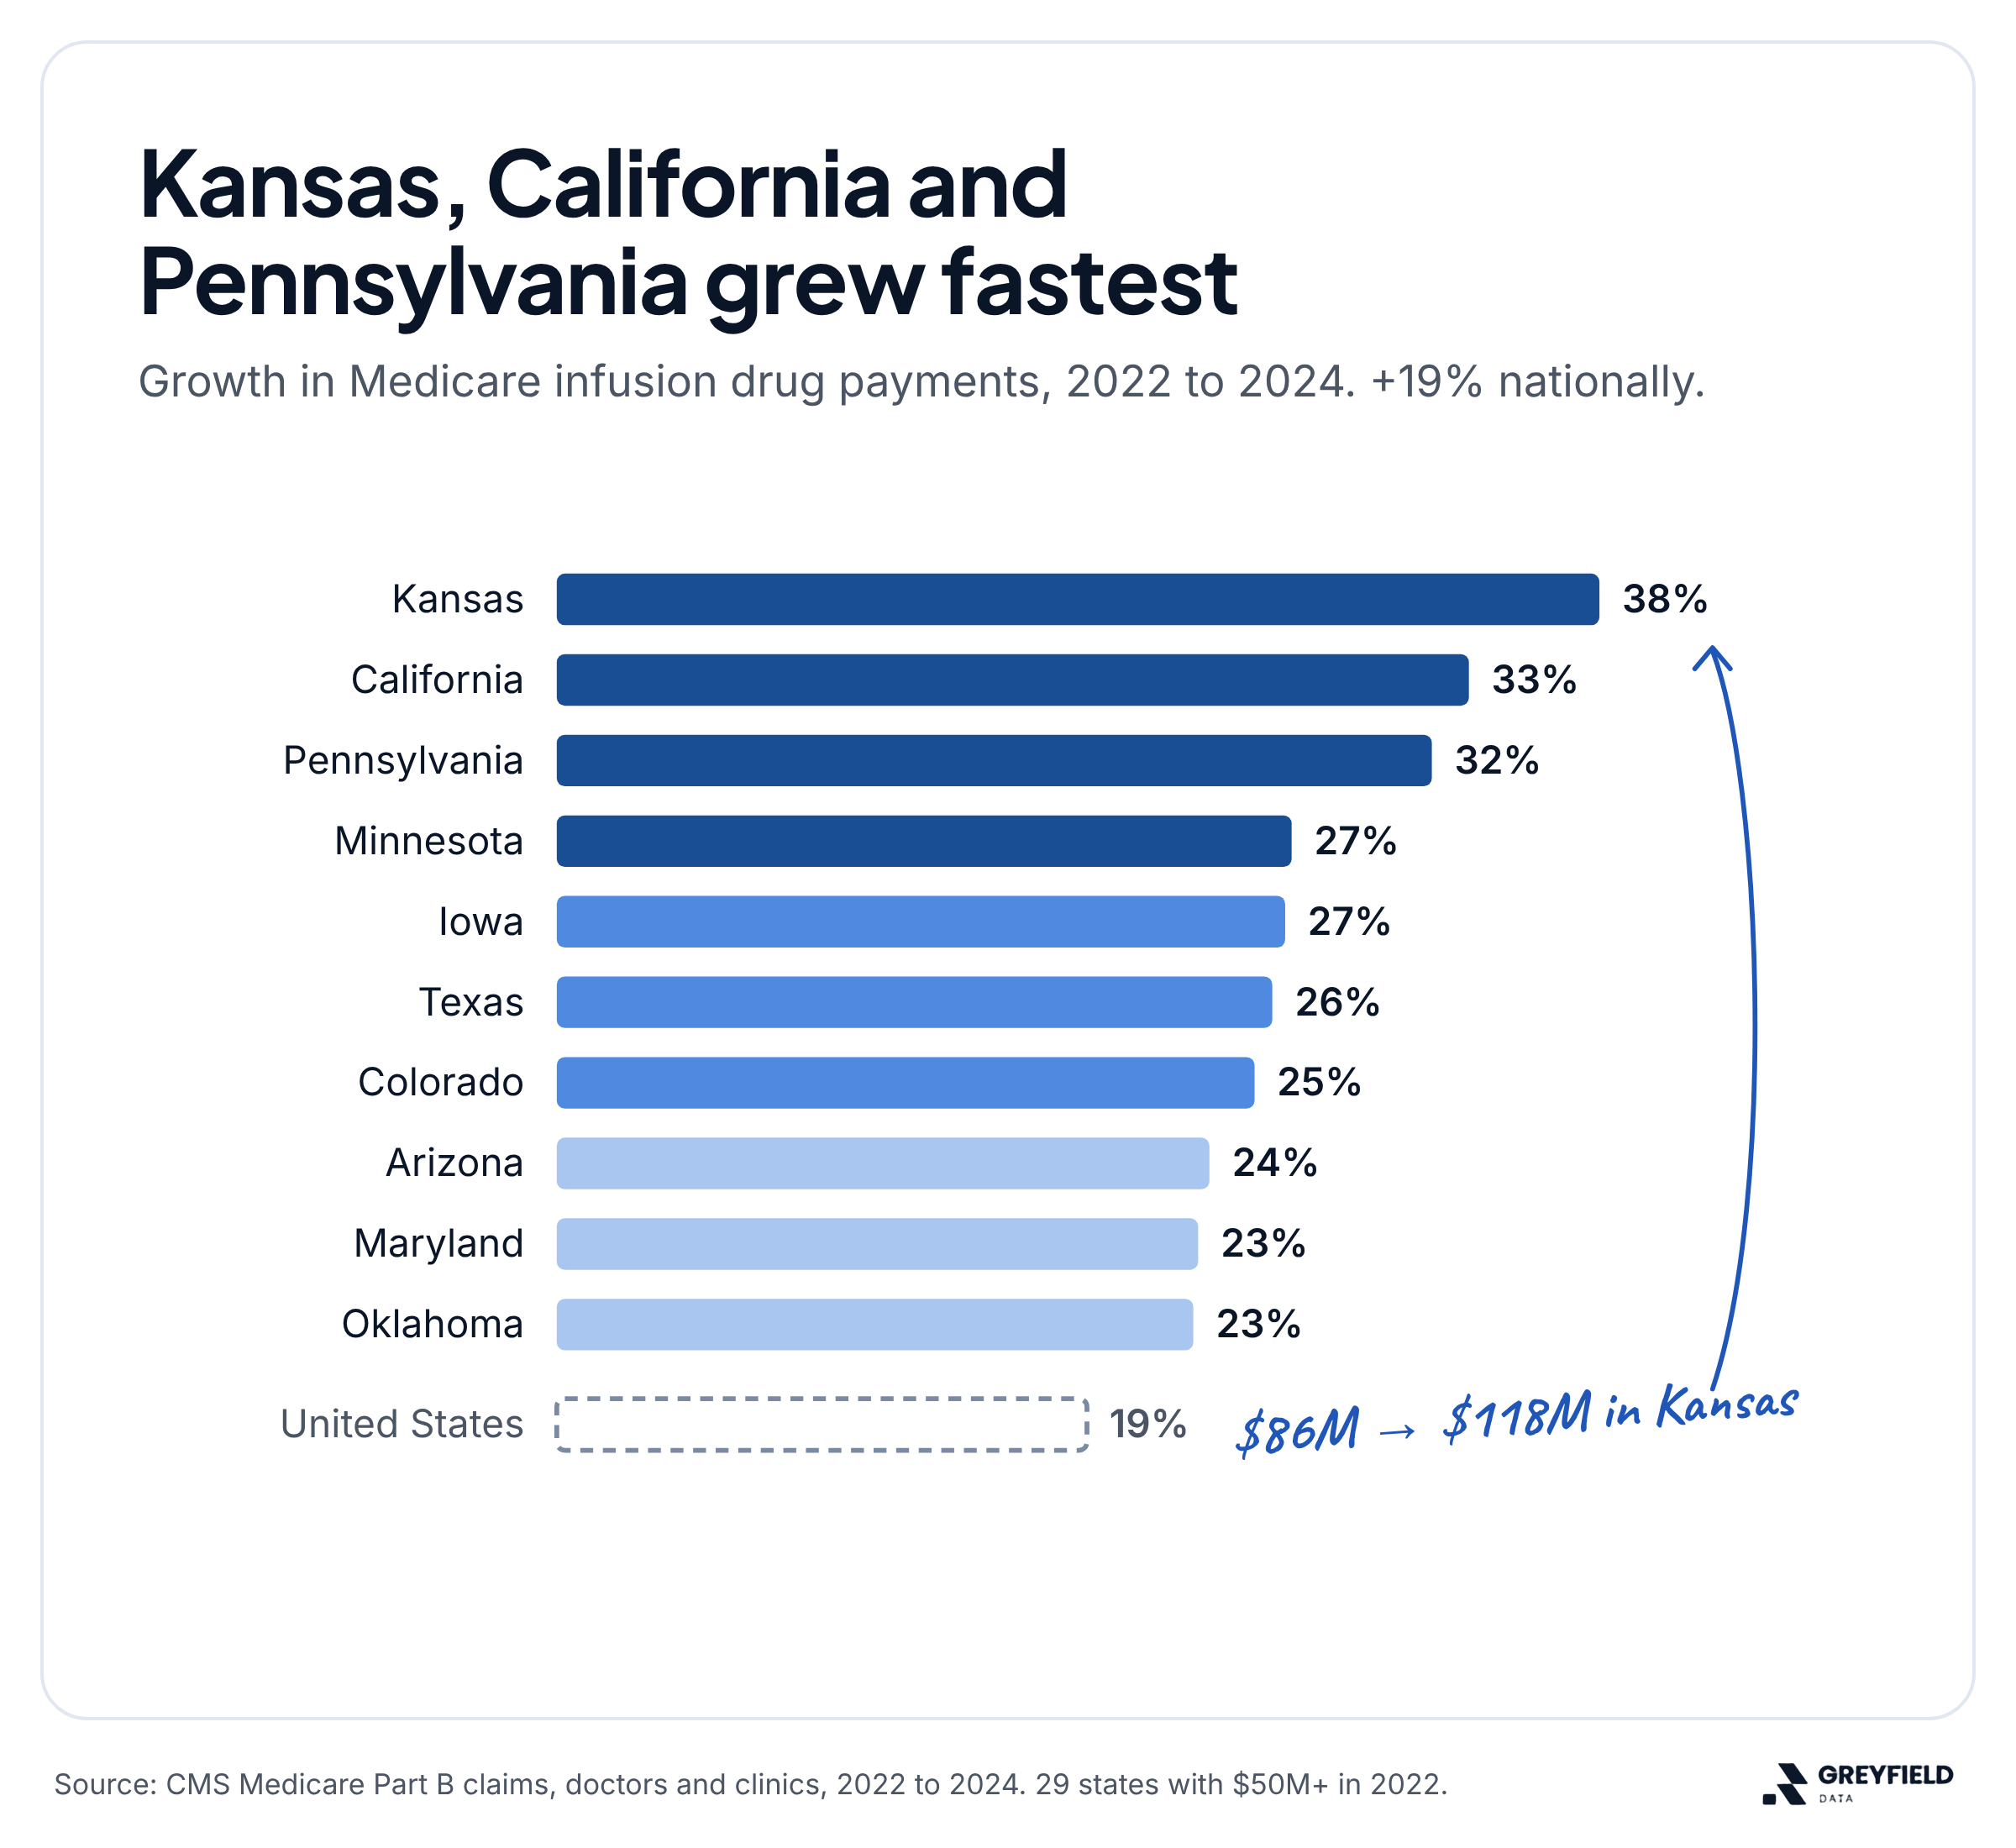
Growth by state for the 29 states with at least $50M in 2022, and the 18 largest markets with their providers, infusion centers and open nursing jobs.
Demand per infusion center
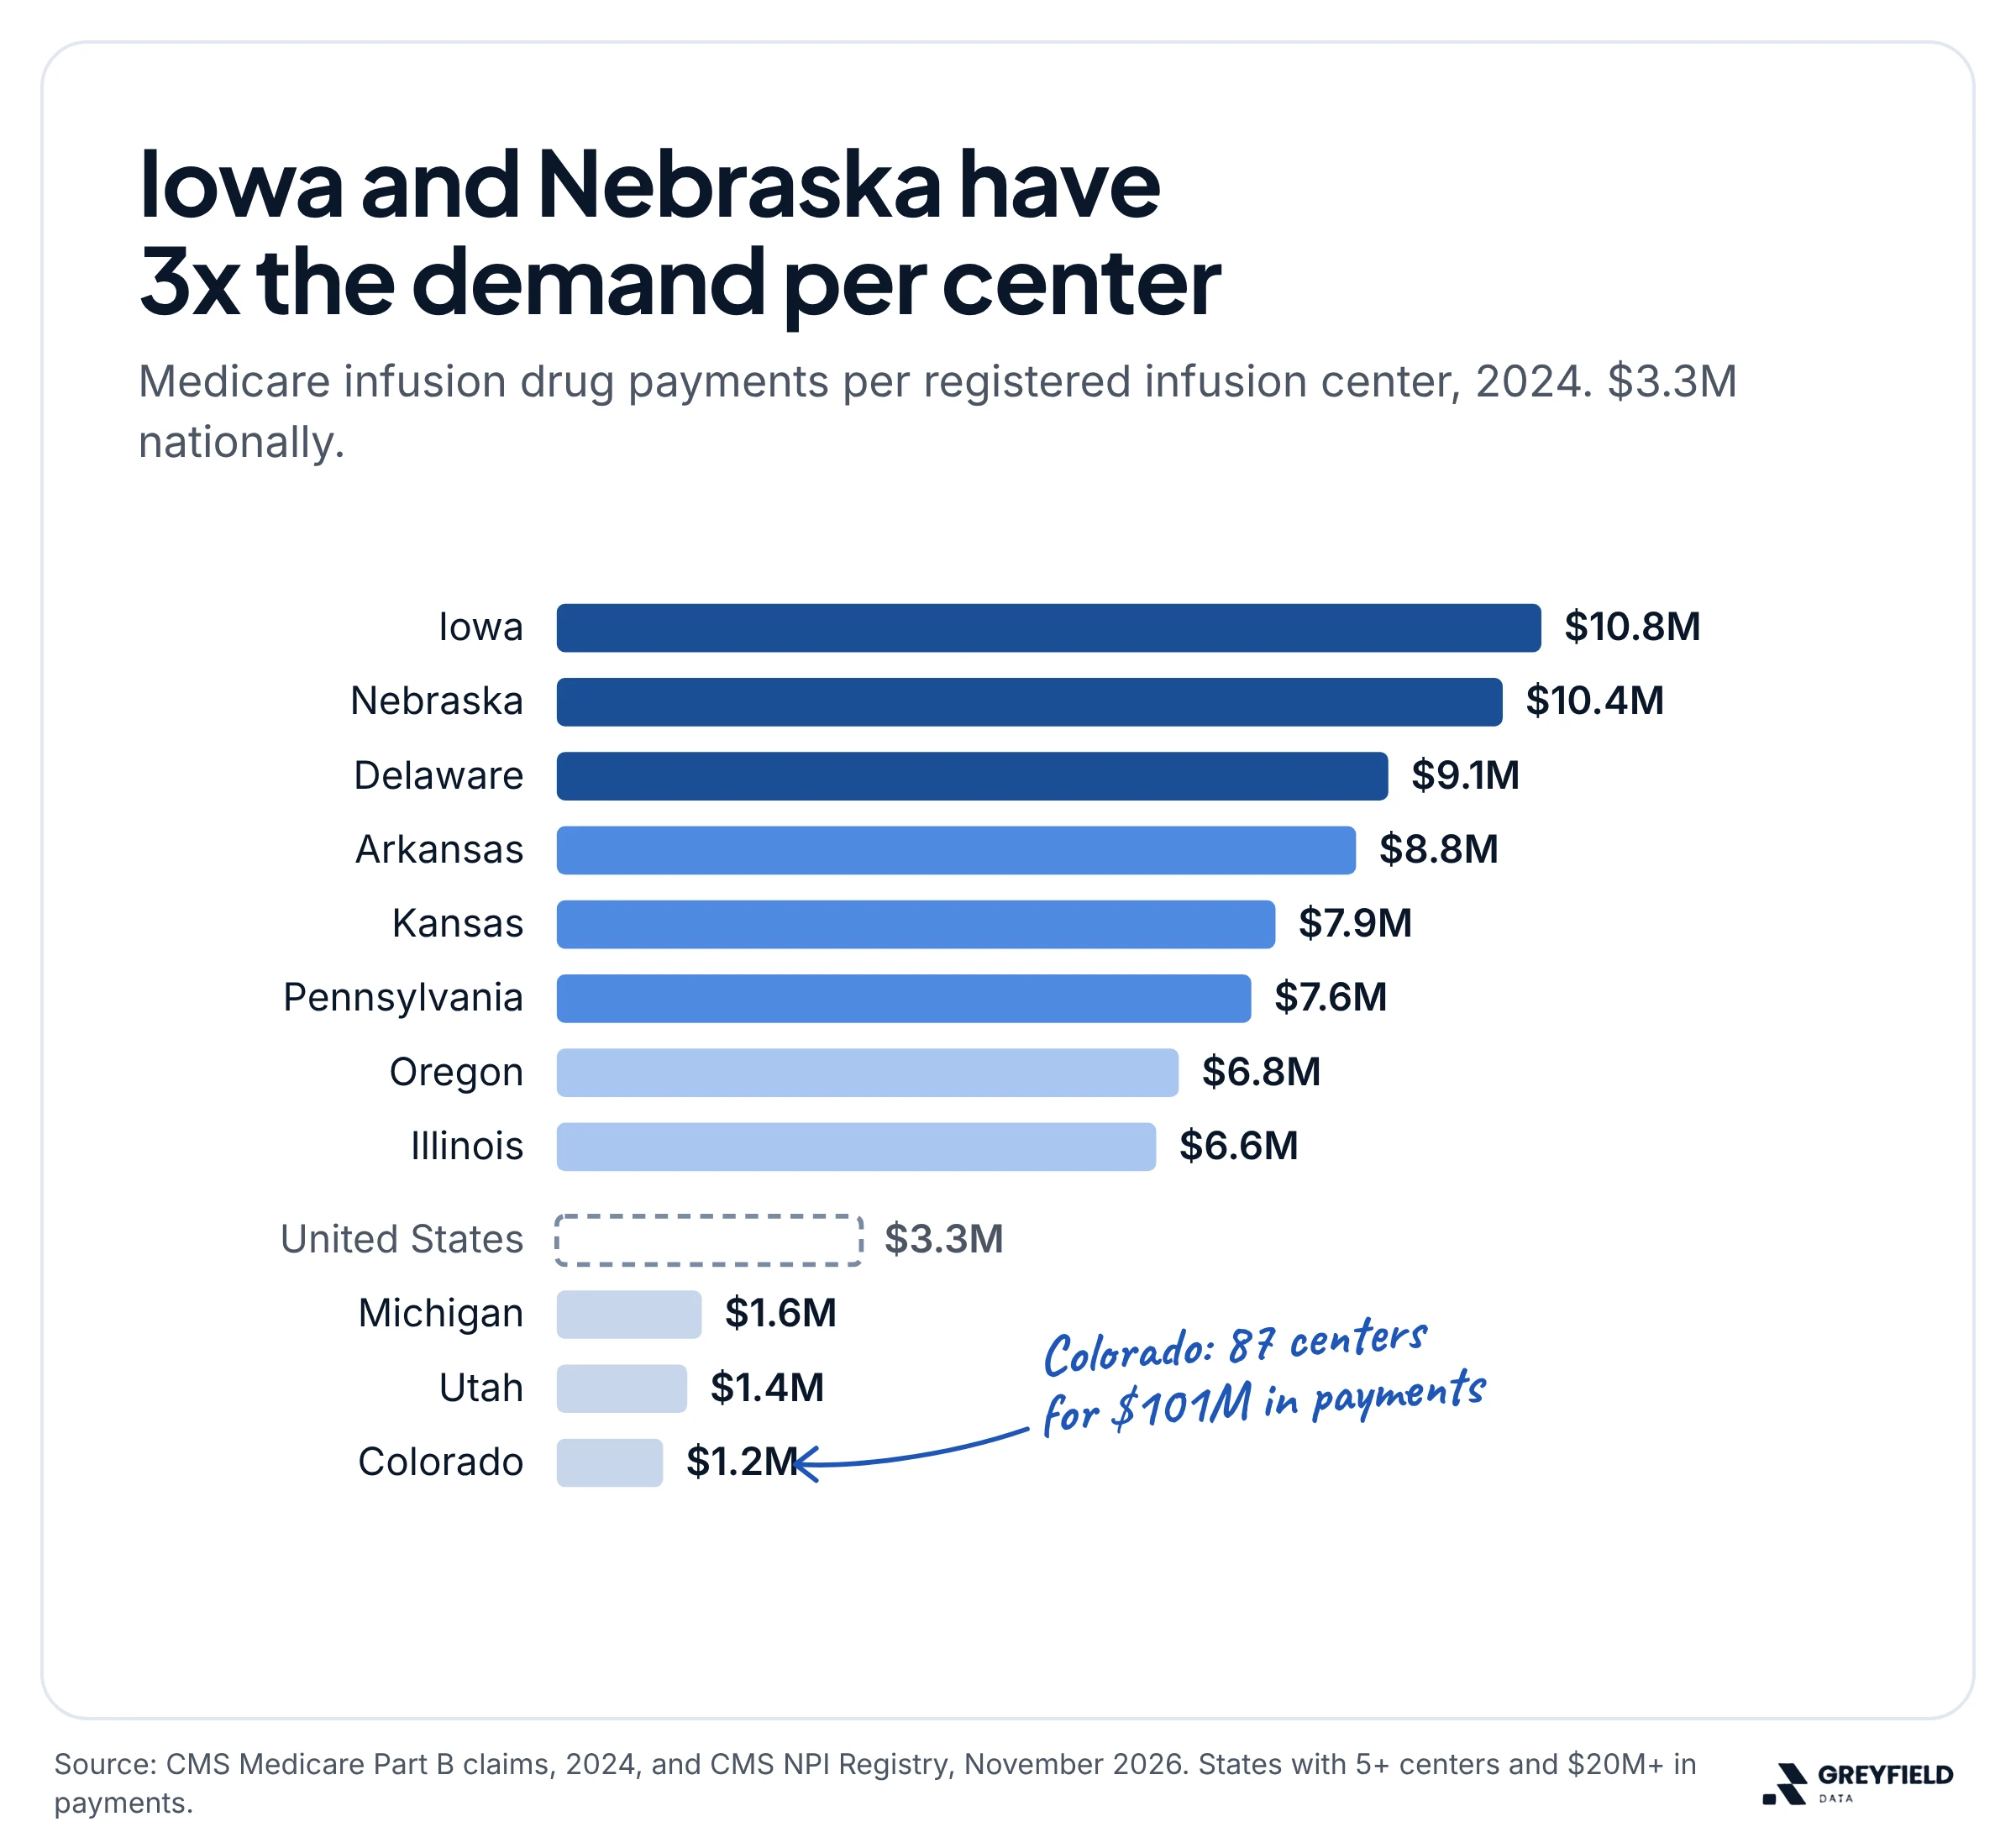
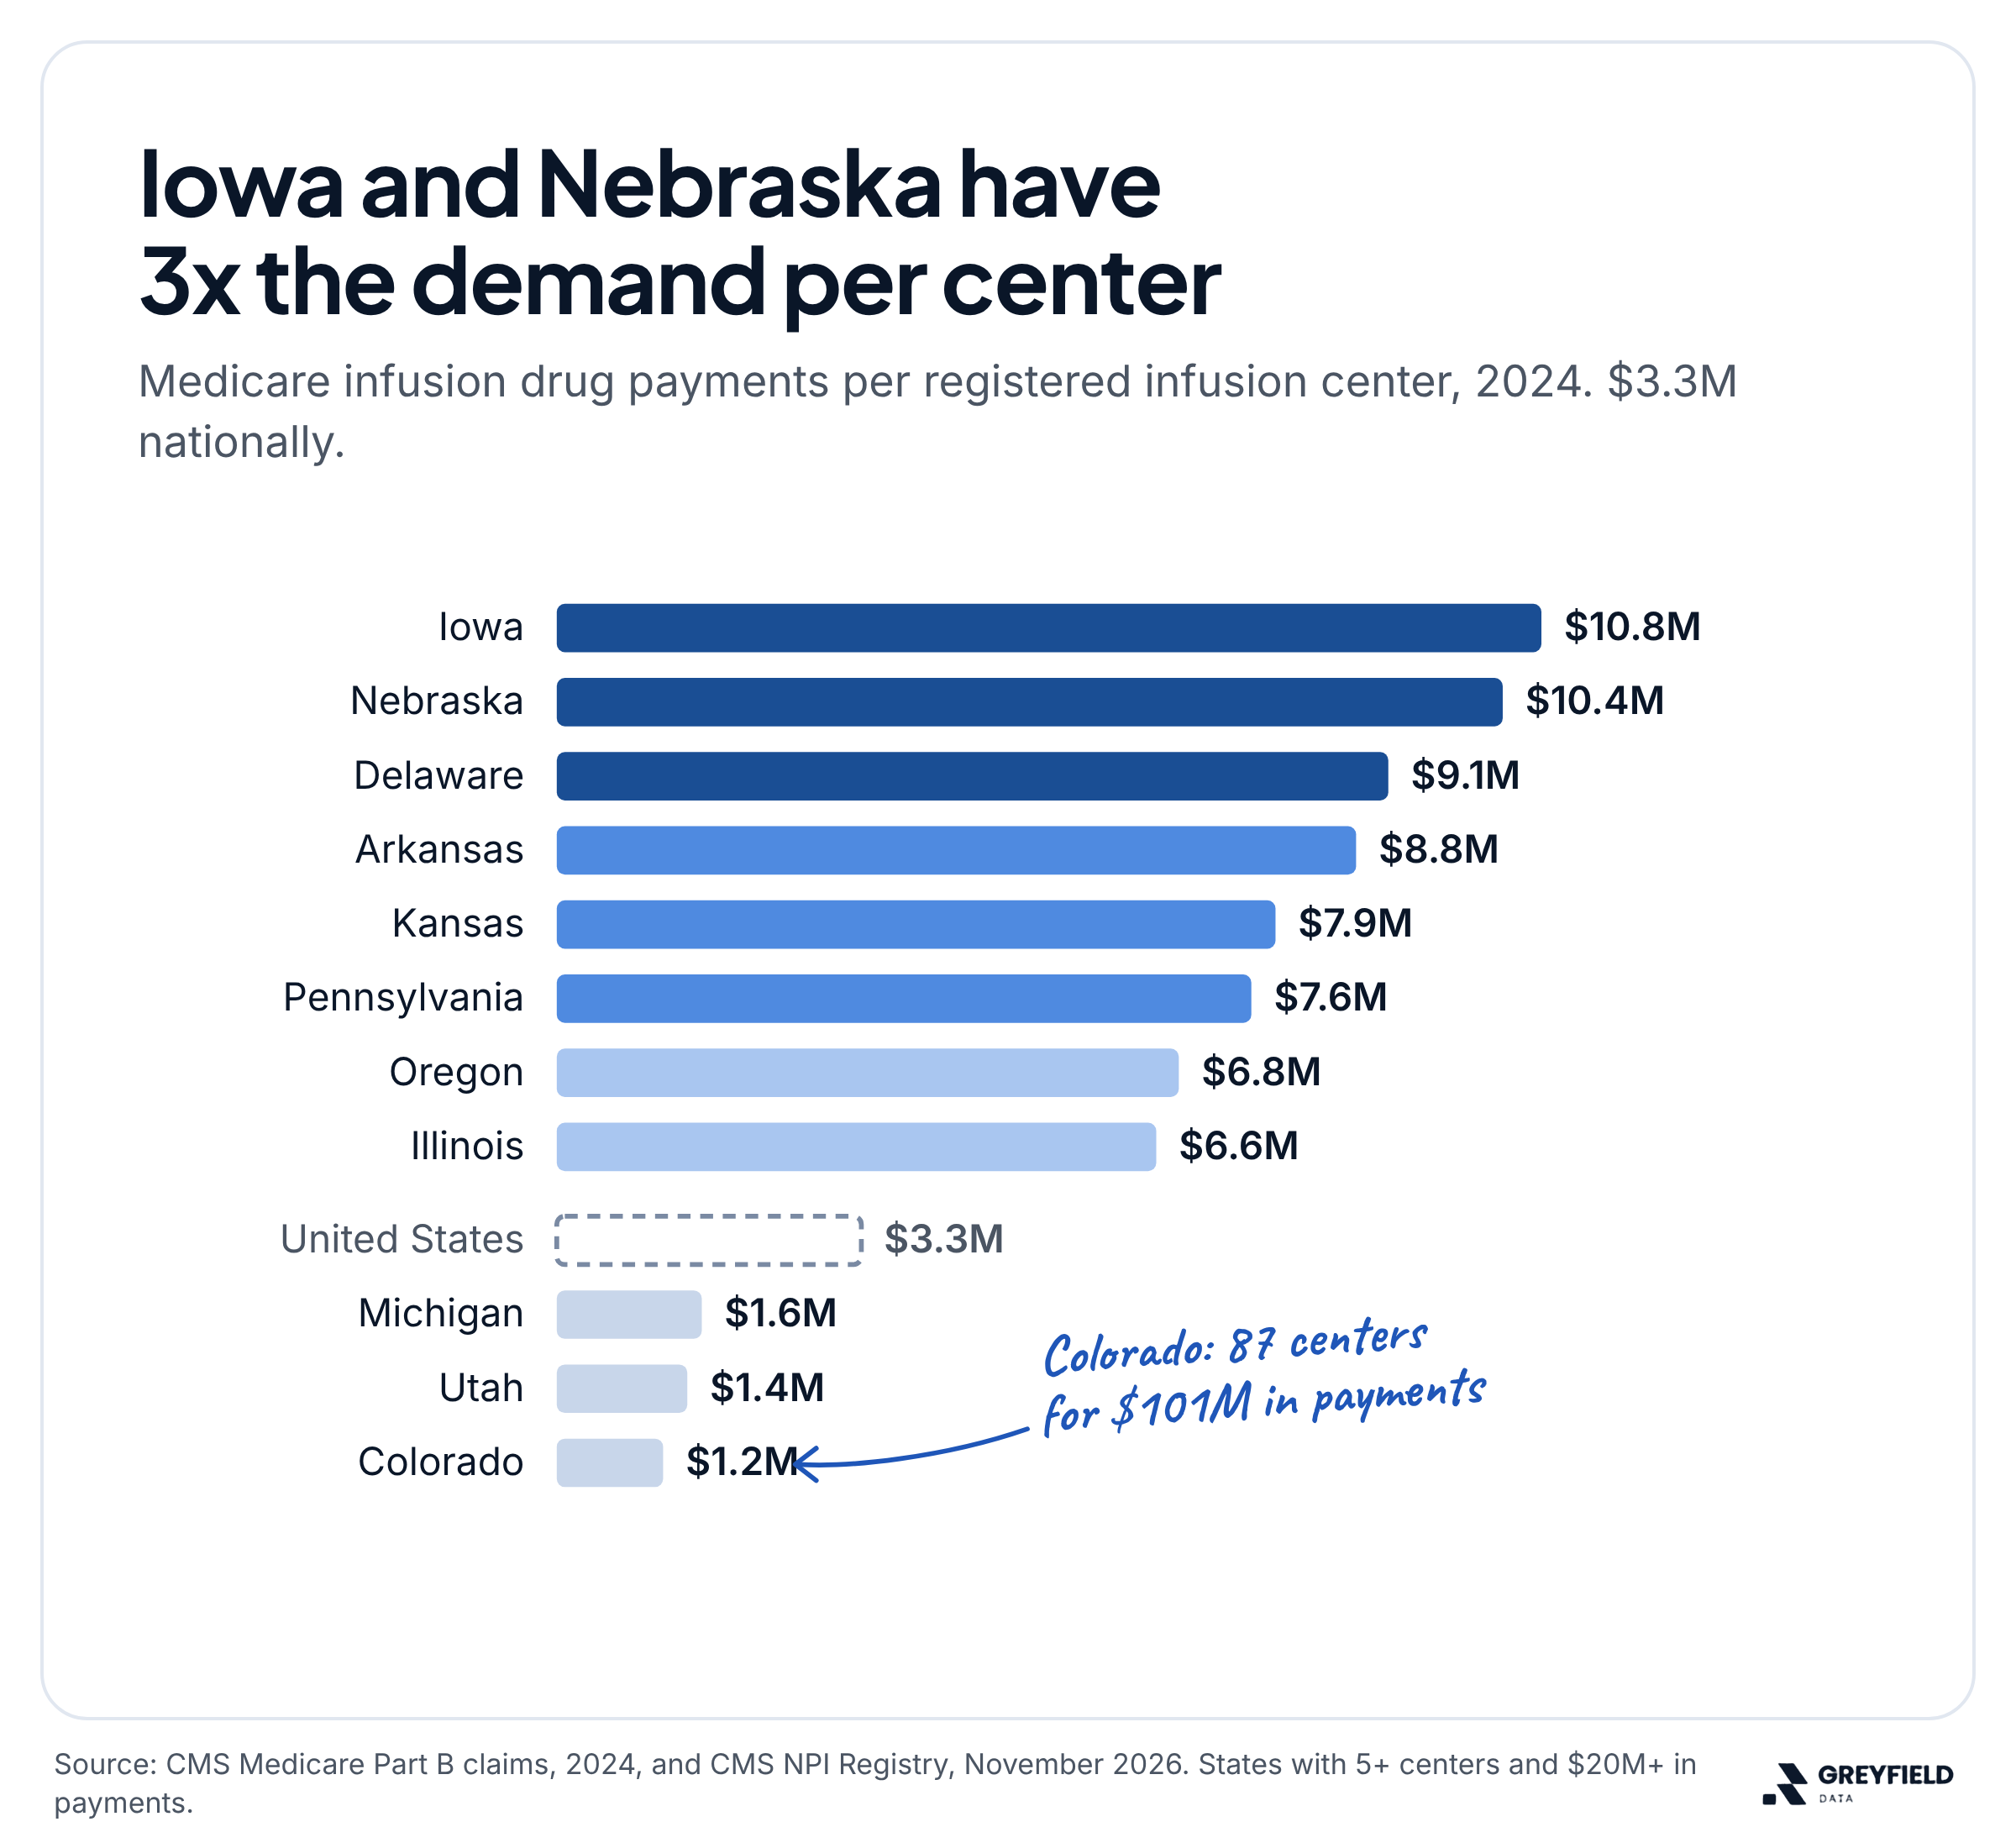
Medicare infusion drug payments per registered infusion center in each state, from more than $10M in Iowa and Nebraska to about $1M in Colorado.
Therapies and who gives infusions
The ten largest Part B infusion drugs and their growth since 2022, and which specialties bill office infusions, from oncology to nurse practitioners.
Contents
- The short versionpage 2
- Spending up, infusions downpage 3
- Where demand is growingpage 4
- The biggest marketspage 5
- Demand per infusion centerpage 6
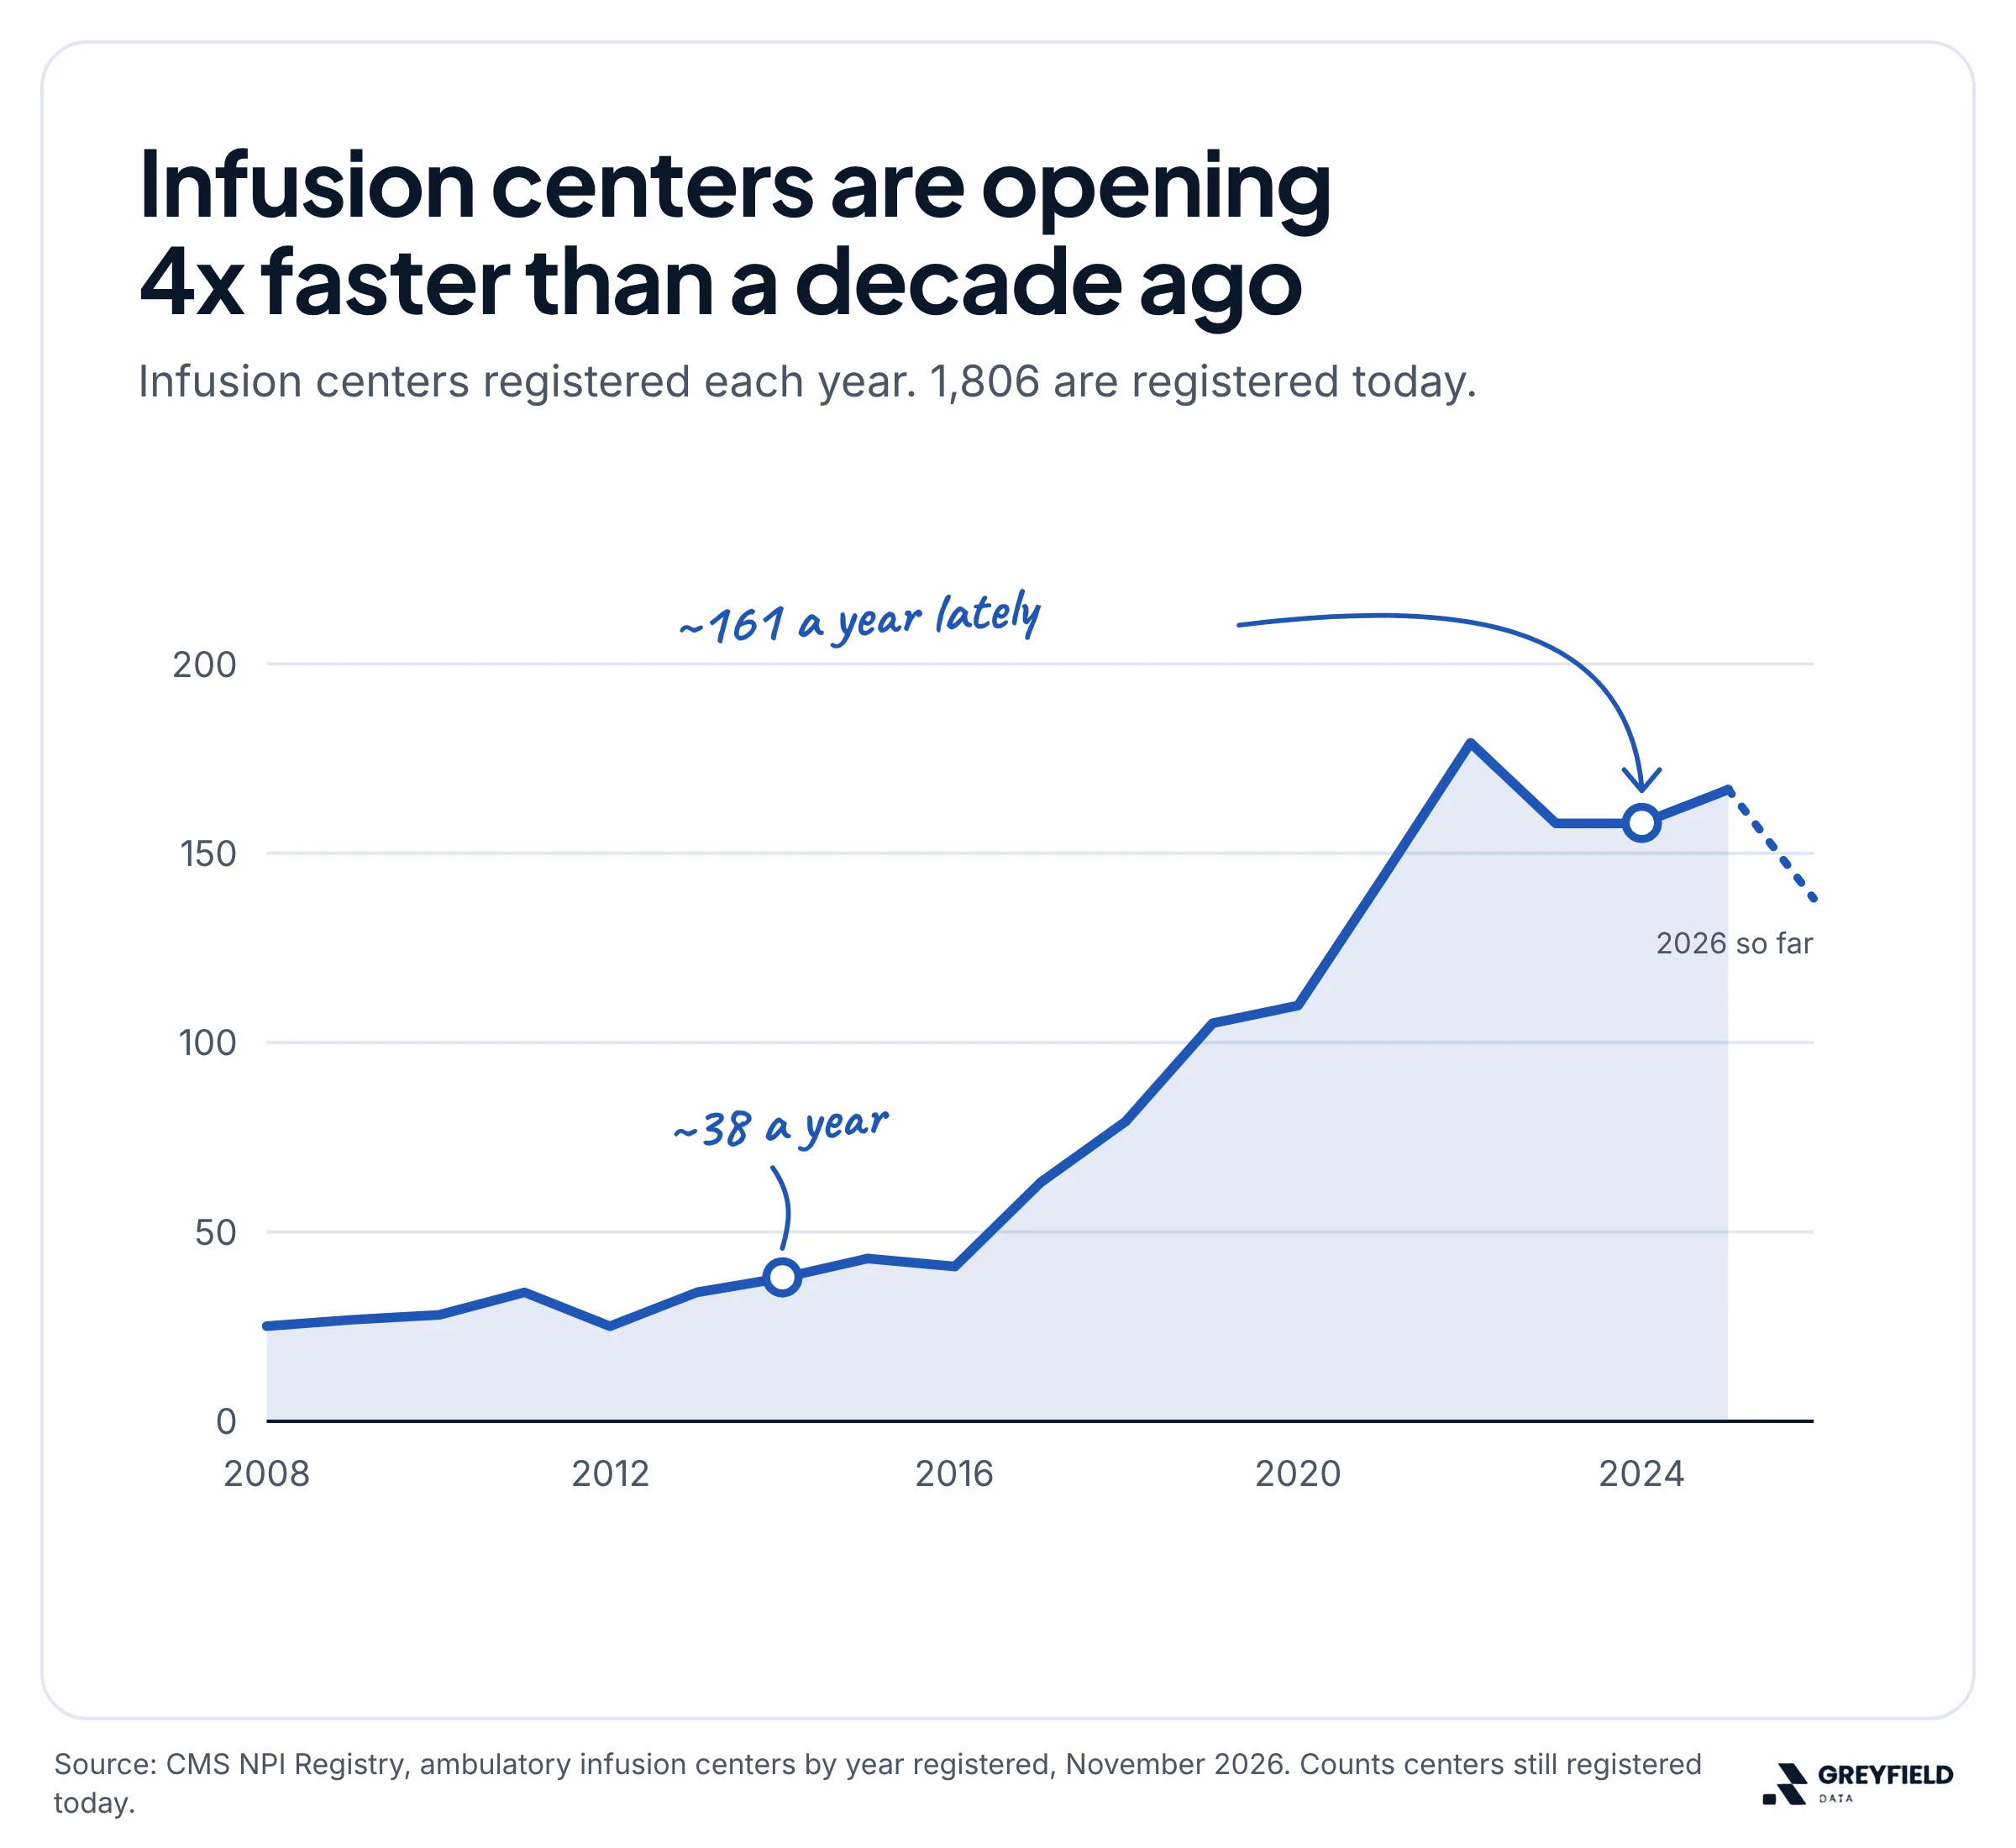
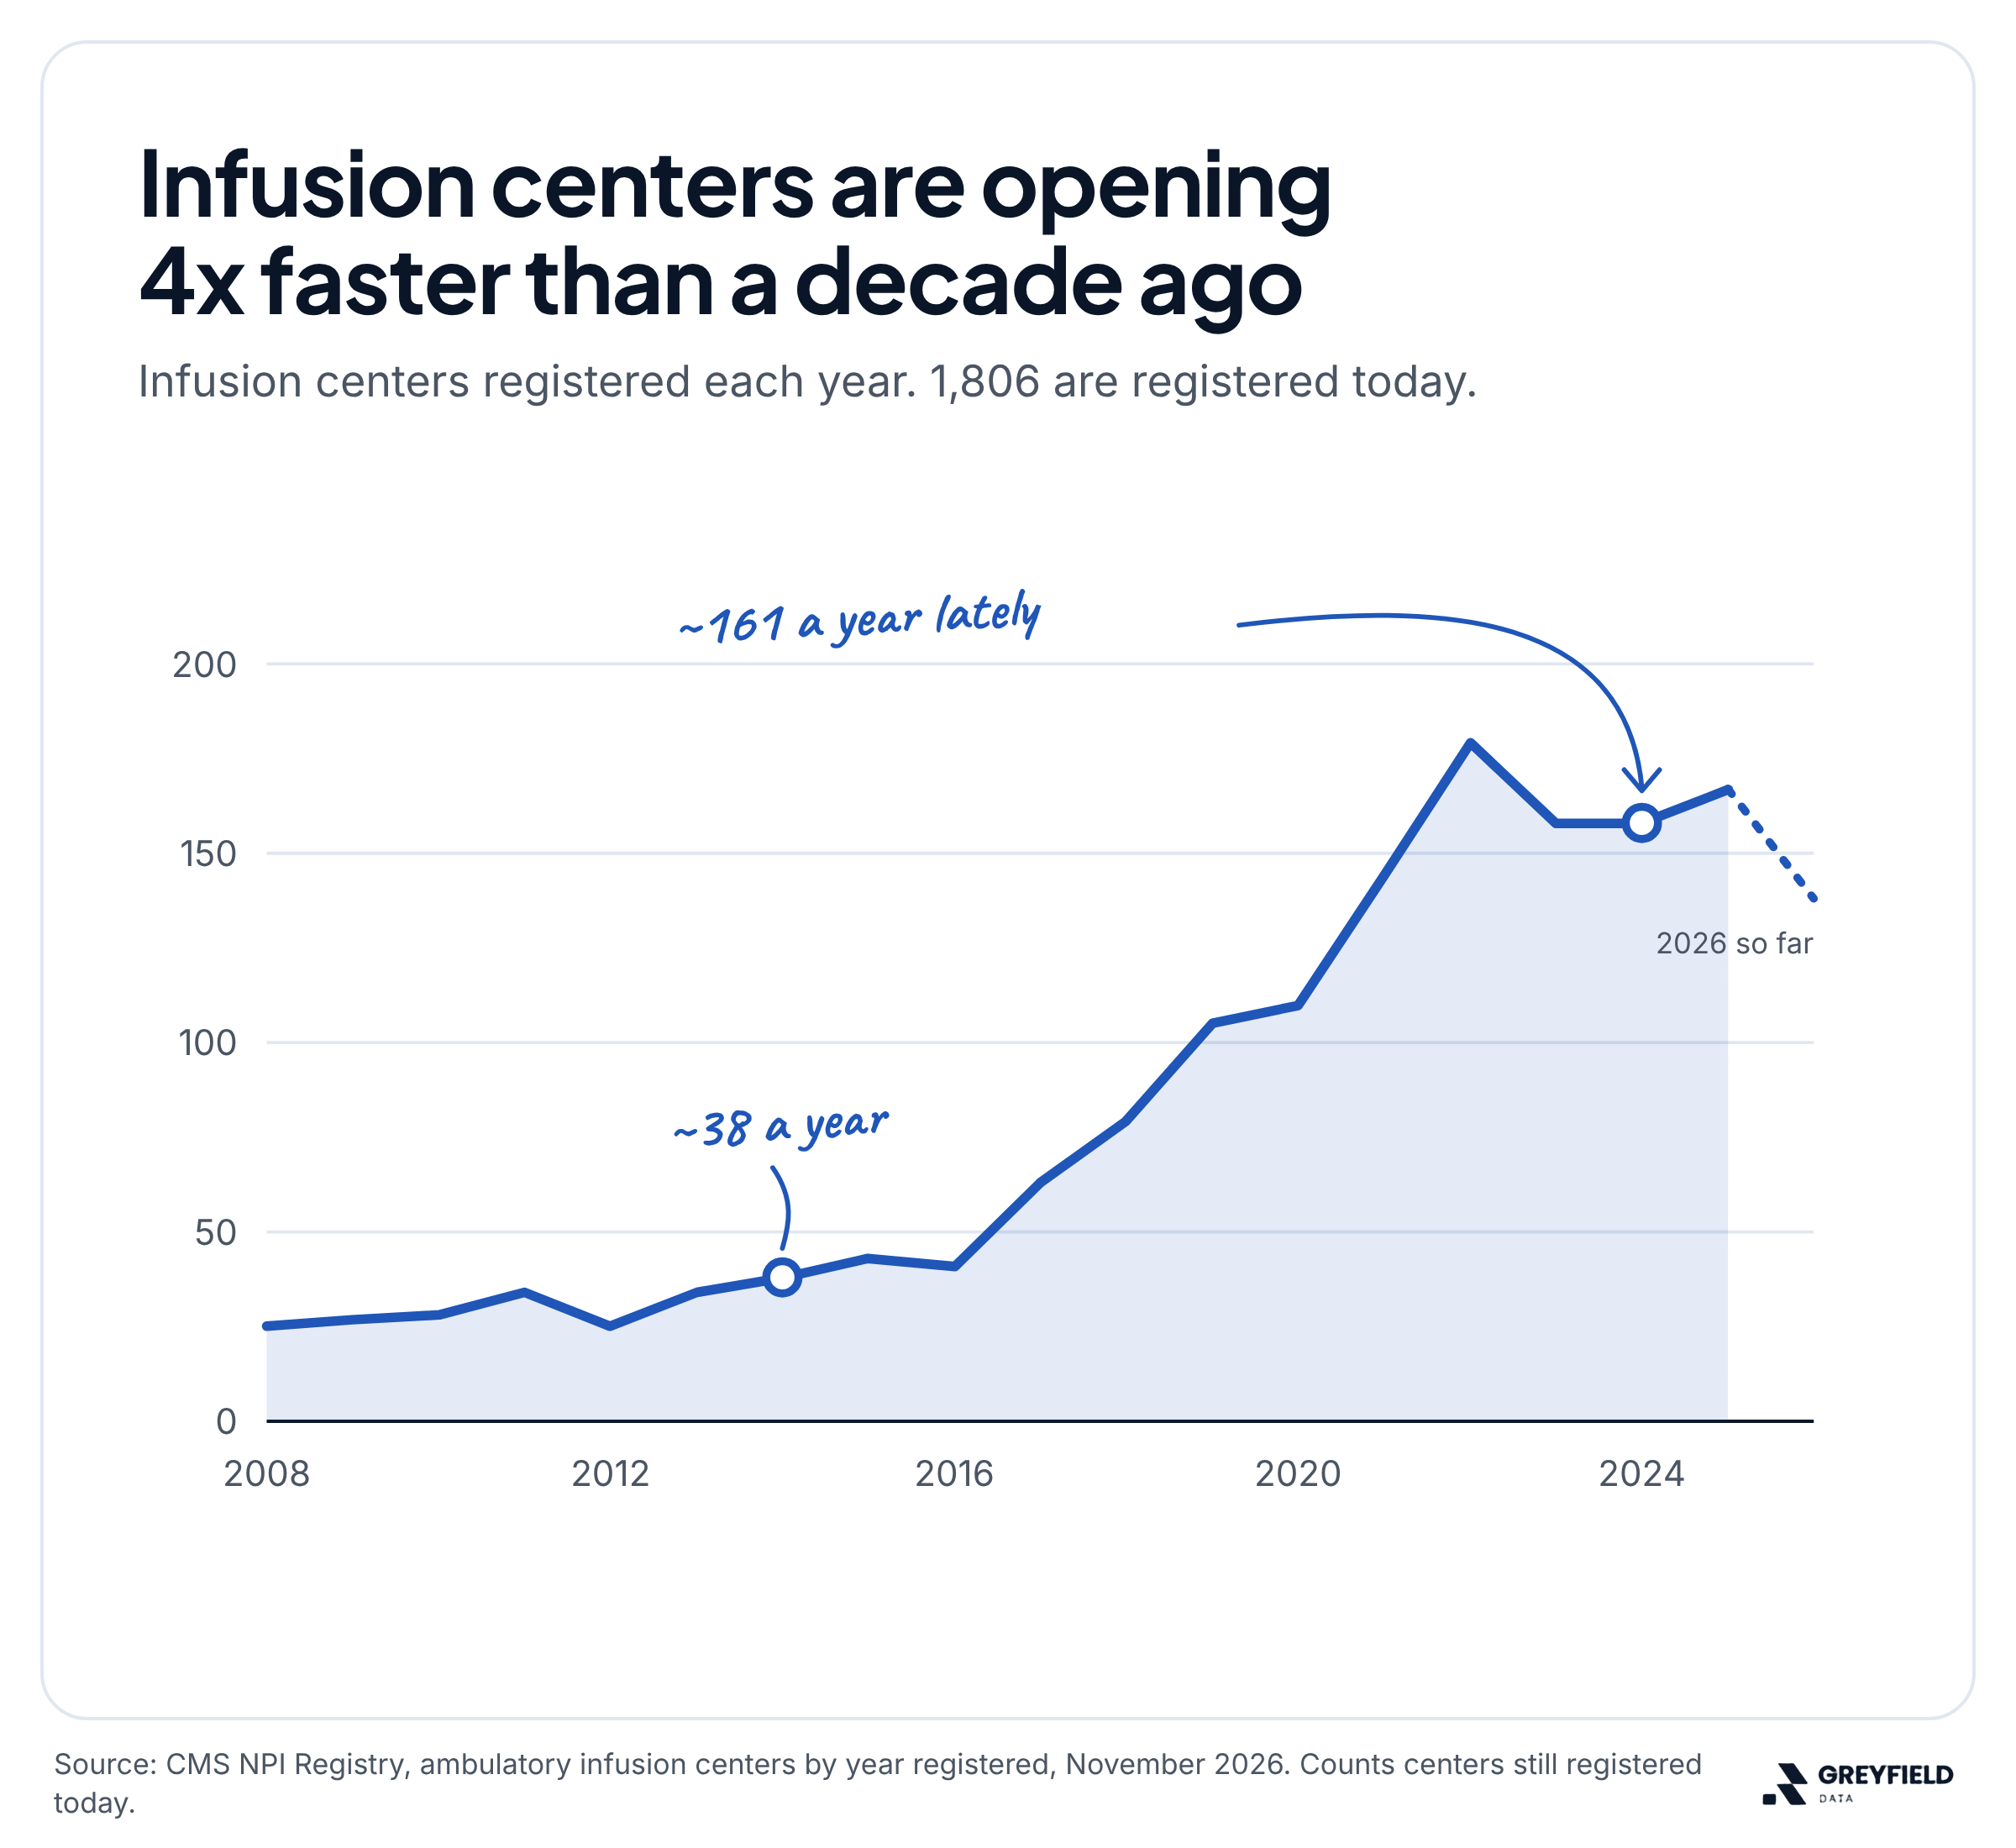
- How fast centers are openingpage 7
- The therapies behind the growthpage 8
- Who gives infusionspage 9
- Reading this for your own marketpage 10
Charts From the Report