How to work backward from a revenue goal for a webinar launch
A Google Sheets calculator that turns a revenue goal into page visitors, tickets, applicants, and clients, per launch and per webinar. With the formulas and a worked $1M example.

Greyfield Data
In this article 6 sections
"We want to do a million this year" is a goal. "We need about 4,100 page visitors and 98 ticket sales per webinar, ten times" is a plan. This Google Sheets calculator turns the first into the second for a launch that sells webinar tickets, then a workshop, then a high-ticket program.
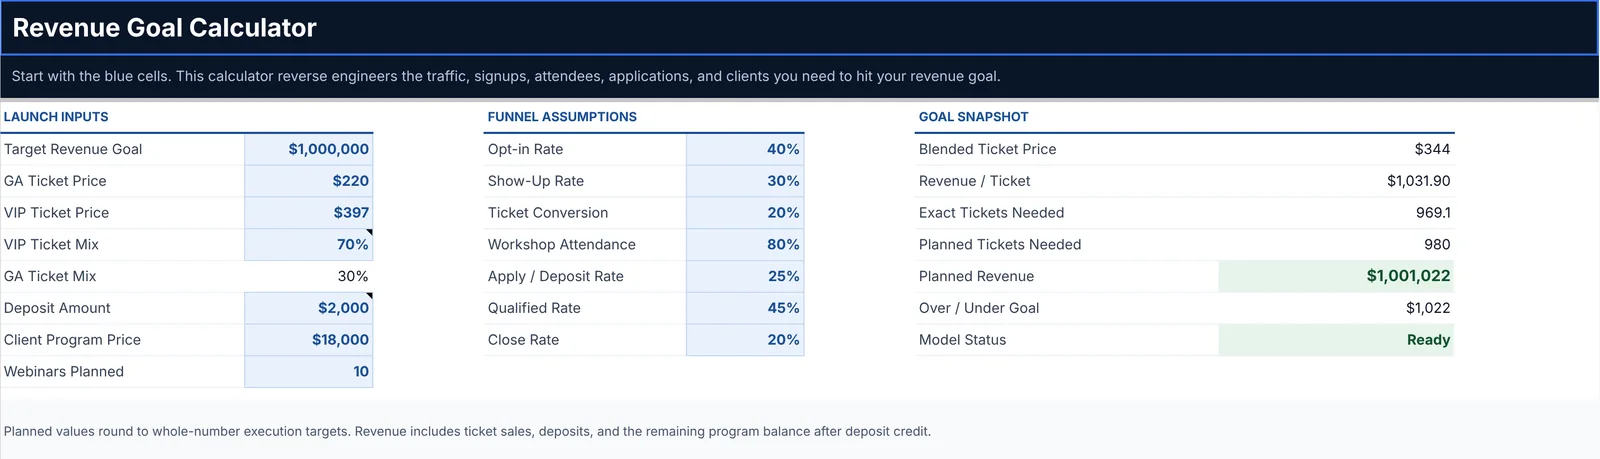
Open the Revenue Goal Calculator in Google Sheets. It's view-only, so use File > Make a copy to change the inputs.
The funnel it models
Each stage converts into the next:
- Page visitors opt in.
- Opt-ins show up to the webinar.
- Webinar attendees buy a ticket to the workshop, either GA or VIP.
- Ticket buyers attend the workshop.
- Workshop attendees apply and pay a deposit.
- Applicants are qualified.
- Qualified applicants close as clients and pay the rest of the program price.
You set the blue input cells: the revenue goal, ticket prices and VIP mix, the deposit, the program price, the number of webinars, and a conversion rate for each stage.
The key formula: revenue per ticket
Money comes in at three points: ticket sales, deposits, and the program balance. The calculator collapses all three into what each ticket sold is worth on average.
| Part | Formula | Example |
|---|---|---|
| Blended ticket price | GA price × GA mix + VIP price × VIP mix | $220 × 30% + $397 × 70% = $343.90 |
| Deposit value per ticket | attendance × apply rate × deposit | 80% × 25% × $2,000 = $400.00 |
| Program value per ticket | attendance × apply × qualified × close × (program price − deposit) | 80% × 25% × 45% × 20% × $16,000 = $288.00 |
| Revenue per ticket | sum of the three | $1,031.90 |
Divide the goal by revenue per ticket and you get the exact tickets needed: $1,000,000 ÷ $1,031.90 = 969.1 tickets.
Note that the program value uses the price minus the deposit. The deposit is credited toward the program, so counting the full program price would count the deposit twice.
Why the plan says 980 tickets, not 970
You can't sell 969.1 tickets or close 17.4 clients. The calculator rounds down at every stage after the ticket sale (you only get whole attendees, applicants, and clients), then looks for the smallest number of tickets that still reaches the goal once everything is rounded.
A hidden Engine tab does this. It lists ticket counts from 1 to 50,000, works out the whole-number outcome of each, and the calculator picks the first one that meets the goal. With these inputs that's 980 tickets, which plans out to $1,001,022, or $1,022 over the goal. Earlier stages are rounded up, so the traffic target never comes in short.
If the goal can't be reached within 50,000 tickets, or the program price isn't above the deposit, the Model Status cell says so instead of showing a wrong number.
The plan, stage by stage

| Stage | Rate | Planned total | Per webinar (10) |
|---|---|---|---|
| Page visitors | 40,835 | 4,084 | |
| Opt-ins | 40% | 16,334 | 1,634 |
| Webinar attendees | 30% | 4,900 | 490 |
| Tickets sold | 20% | 980 | 98 |
| Workshop attendees | 80% | 784 | 79 |
| Deposits | 25% | 196 | 20 |
| Qualified applicants | 45% | 88 | 9 |
| Clients closed | 20% | 17 | 2 |
The revenue mix is the part people tend not to expect:
| Revenue stream | Count | Unit | Revenue |
|---|---|---|---|
| Tickets (686 VIP, 294 GA) | 980 | $343.90 avg | $337,022 |
| Deposits | 196 | $2,000 | $392,000 |
| Program balance | 17 | $16,000 | $272,000 |
| Total | $1,001,022 |
With these assumptions, deposits bring in more than closed programs, and tickets bring in about a third of the total. Whether that holds depends on your refund policy. If deposits are refundable when an applicant isn't accepted, you would count only the qualified share, and the plan would need more tickets.
Pressure-test the assumptions
The calculator is most useful for comparing scenarios before you commit:
- Raise the VIP mix and the blended ticket price rises, so fewer tickets are needed.
- Lower the show-up rate by five points and watch the traffic target jump. Top-of-funnel rates multiply all the way down.
- Change the number of webinars to see whether 98 tickets per event is realistic for your audience. The total doesn't change, but the per-event target does.
Use the exact values to compare scenarios and the planned values as operating targets.
Make it your own
The model only works if the conversion rates are yours. Use rates from your last launch where you have them, and treat everything else as a guess to check after the first webinar. If your funnel has a different shape, such as no paid ticket or a free strategy call instead of a workshop, the same approach applies: put a value on each step, add them into revenue per entry, and divide.
Want this as a tool your prospects can use on your own site, like the reporting time calculator? See the other demos, or book a call to talk through a custom one.